

Strona 2_redak - Instytut Agrofizyki im. Bohdana DobrzaÅskiego ...
Strona 2_redak - Instytut Agrofizyki im. Bohdana DobrzaÅskiego ...
Strona 2_redak - Instytut Agrofizyki im. Bohdana DobrzaÅskiego ...

Create successful ePaper yourself
Turn your PDF publications into a flip-book with our unique Google optimized e-Paper software.
42<br />
5.2. Density of consolidated material<br />
The density of granular material is a monotonically increasing non-linear<br />
function of pressure. The function most frequently used for the description of the<br />
relation is a power, exponential or logarithmic function. Gu et al. [59] made a detailed<br />
analysis of empirical relationships used, determining for each the range of<br />
pressure values for which a given function best describes the change in density.<br />
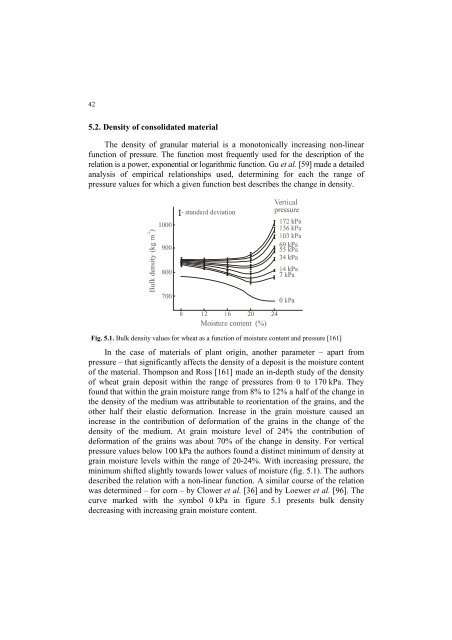
Fig. 5.1. Bulk density values for wheat as a function of moisture content and pressure [161]<br />
In the case of materials of plant origin, another parameter – apart from<br />
pressure – that significantly affects the density of a deposit is the moisture content<br />
of the material. Thompson and Ross [161] made an in-depth study of the density<br />
of wheat grain deposit within the range of pressures from 0 to 170 kPa. They<br />
found that within the grain moisture range from 8% to 12% a half of the change in<br />
the density of the medium was attributable to reorientation of the grains, and the<br />
other half their elastic deformation. Increase in the grain moisture caused an<br />
increase in the contribution of deformation of the grains in the change of the<br />
density of the medium. At grain moisture level of 24% the contribution of<br />
deformation of the grains was about 70% of the change in density. For vertical<br />
pressure values below 100 kPa the authors found a distinct min<strong>im</strong>um of density at<br />
grain moisture levels within the range of 20-24%. With increasing pressure, the<br />
min<strong>im</strong>um shifted slightly towards lower values of moisture (fig. 5.1). The authors<br />
described the relation with a non-linear function. A s<strong>im</strong>ilar course of the relation<br />
was determined – for corn – by Clower et al. [36] and by Loewer et al. [96]. The<br />
curve marked with the symbol 0 kPa in figure 5.1 presents bulk density<br />
decreasing with increasing grain moisture content.


