

Strona 2_redak - Instytut Agrofizyki im. Bohdana DobrzaÅskiego ...
Strona 2_redak - Instytut Agrofizyki im. Bohdana DobrzaÅskiego ...
Strona 2_redak - Instytut Agrofizyki im. Bohdana DobrzaÅskiego ...

You also want an ePaper? Increase the reach of your titles
YUMPU automatically turns print PDFs into web optimized ePapers that Google loves.
69<br />
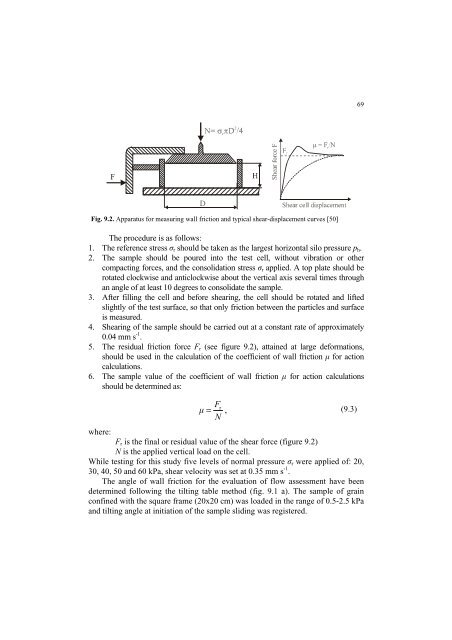
Fig. 9.2. Apparatus for measuring wall friction and typical shear-displacement curves [50]<br />
The procedure is as follows:<br />
1. The reference stress 1 r should be taken as the largest horizontal silo pressure p h .<br />
2. The sample should be poured into the test cell, without vibration or other<br />
compacting forces, and the consolidation stress 1 r applied. A top plate should be<br />
rotated clockwise and anticlockwise about the vertical axis several t<strong>im</strong>es through<br />
an angle of at least 10 degrees to consolidate the sample.<br />
3. After filling the cell and before shearing, the cell should be rotated and lifted<br />
slightly of the test surface, so that only friction between the particles and surface<br />
is measured.<br />
4. Shearing of the sample should be carried out at a constant rate of approx<strong>im</strong>ately<br />
0.04 mm s -1 .<br />
5. The residual friction force F r (see figure 9.2), attained at large deformations,<br />
should be used in the calculation of the coefficient of wall friction for action<br />
calculations.<br />
6. The sample value of the coefficient of wall friction for action calculations<br />
should be determined as:<br />
Fr<br />
= , (9.3)<br />
N<br />
where:<br />
F r is the final or residual value of the shear force (figure 9.2)<br />
N is the applied vertical load on the cell.<br />
While testing for this study five levels of normal pressure 1 r were applied of: 20,<br />
30, 40, 50 and 60 kPa, shear velocity was set at 0.35 mm s -1 .<br />
The angle of wall friction for the evaluation of flow assessment have been<br />
determined following the tilting table method (fig. 9.1 a). The sample of grain<br />
confined with the square frame (20x20 cm) was loaded in the range of 0.5-2.5 kPa<br />
and tilting angle at initiation of the sample sliding was registered.


