

Strona 2_redak - Instytut Agrofizyki im. Bohdana DobrzaÅskiego ...
Strona 2_redak - Instytut Agrofizyki im. Bohdana DobrzaÅskiego ...
Strona 2_redak - Instytut Agrofizyki im. Bohdana DobrzaÅskiego ...

You also want an ePaper? Increase the reach of your titles
YUMPU automatically turns print PDFs into web optimized ePapers that Google loves.
55<br />
7.2. Factors influencing angle of internal friction of cereals<br />
7.2.1. Moisture content of the material<br />
Grain moisture content has deep influence on the mechanical properties of<br />
grain in bulk [67] as it modifies surface properties of seed-coat as well as the<br />
properties of kernel endosperm. Changing moisture content of grain influences<br />
shear stress-strain characteristics, and consequently the determination of strength<br />
parameters: the angle of internal friction φ and the cohesion c. Figure 7.4 presents<br />
data obtained in direct shear test for wheat of moisture contents of 12, 20 and 22%.<br />
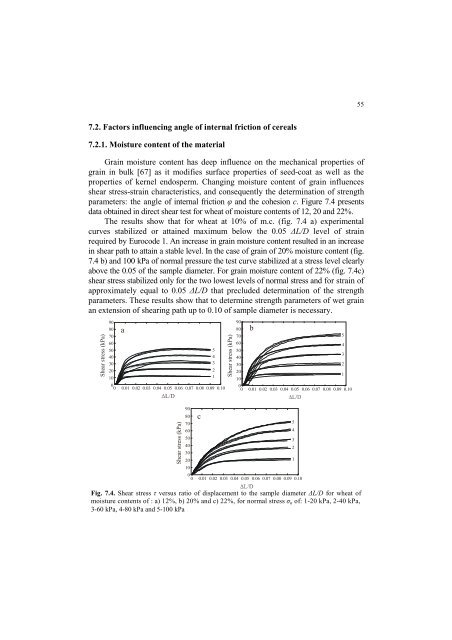
The results show that for wheat at 10% of m.c. (fig. 7.4 a) exper<strong>im</strong>ental<br />
curves stabilized or attained max<strong>im</strong>um below the 0.05 ∆L/D level of strain<br />
required by Eurocode 1. An increase in grain moisture content resulted in an increase<br />
in shear path to attain a stable level. In the case of grain of 20% moisture content (fig.<br />
7.4 b) and 100 kPa of normal pressure the test curve stabilized at a stress level clearly<br />
above the 0.05 of the sample diameter. For grain moisture content of 22% (fig. 7.4c)<br />
shear stress stabilized only for the two lowest levels of normal stress and for strain of<br />
approx<strong>im</strong>ately equal to 0.05 ∆L/D that precluded determination of the strength<br />
parameters. These results show that to determine strength parameters of wet grain<br />
an extension of shearing path up to 0.10 of sample diameter is necessary.<br />
Shear stress (kPa)<br />
90<br />
80<br />
70<br />
60<br />
50<br />
40<br />
30<br />
20<br />
10<br />
a<br />
0<br />
0.01 0.02 0.03 0.04 0.05 0.06 0.07 0.08 0.09 0.10 0<br />
5<br />
4<br />
3<br />
2<br />
1<br />
Shear stress (kPa)<br />
90<br />
80<br />
70<br />
60<br />
50<br />
40<br />
30<br />
20<br />
10<br />
b<br />
5<br />
4<br />
3<br />
2<br />
1<br />
0.01 0.02 0.03 0.04 0.05 0.06 0.07 0.08 0.09 0.10<br />
0 0<br />
0<br />
Shear stress (kPa)<br />
90<br />
80<br />
70<br />
60<br />
50<br />
40<br />
30<br />
20<br />
10<br />
0<br />
c<br />
4<br />
3<br />
2<br />
1<br />
0.01 0.02 0.03 0.04 0.05 0.06 0.07 0.08 0.09 0.10<br />
5<br />
Fig. 7.4. Shear stress τ versus ratio of displacement to the sample diameter ∆L/D for wheat of<br />
moisture contents of : a) 12%, b) 20% and c) 22%, for normal stress σ n of: 1-20 kPa, 2-40 kPa,<br />
3-60 kPa, 4-80 kPa and 5-100 kPa


