

Strona 2_redak - Instytut Agrofizyki im. Bohdana DobrzaÅskiego ...
Strona 2_redak - Instytut Agrofizyki im. Bohdana DobrzaÅskiego ...
Strona 2_redak - Instytut Agrofizyki im. Bohdana DobrzaÅskiego ...

Create successful ePaper yourself
Turn your PDF publications into a flip-book with our unique Google optimized e-Paper software.
54<br />
poured into the box without vibration and the reference stress of 100 kPa was applied.<br />
A top plate was rotated backwards and forwards three t<strong>im</strong>es through an angle of ten<br />
degrees to consolidate the sample. Following consolidation, the sample was sheared<br />
under normal stress equal to reference stress, at the rate of 10.8 mm min -1 . Second<br />
sub-test was performed for consolidation reference stress of 100 kPa and test load<br />
value of normal stress of 50 kPa. Three replications were performed. Triaxial compression<br />
tests with a sample 15 cm in diameter and 30 cm high were conducted on<br />
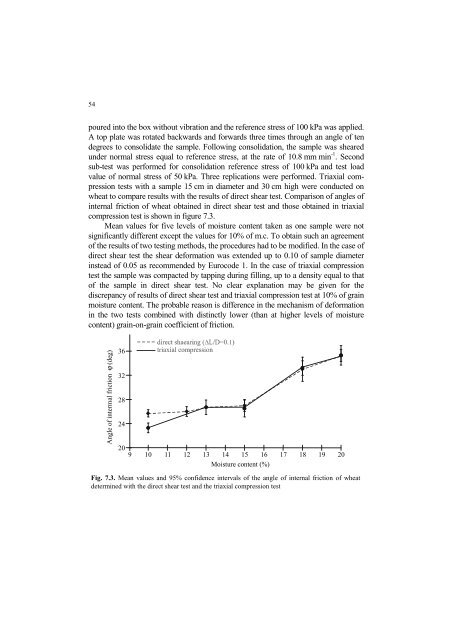
wheat to compare results with the results of direct shear test. Comparison of angles of<br />
internal friction of wheat obtained in direct shear test and those obtained in triaxial<br />
compression test is shown in figure 7.3.<br />
Mean values for five levels of moisture content taken as one sample were not<br />
significantly different except the values for 10% of m.c. To obtain such an agreement<br />
of the results of two testing methods, the procedures had to be modified. In the case of<br />
direct shear test the shear deformation was extended up to 0.10 of sample diameter<br />
instead of 0.05 as recommended by Eurocode 1. In the case of triaxial compression<br />
test the sample was compacted by tapping during filling, up to a density equal to that<br />
of the sample in direct shear test. No clear explanation may be given for the<br />
discrepancy of results of direct shear test and triaxial compression test at 10% of grain<br />
moisture content. The probable reason is difference in the mechanism of deformation<br />
in the two tests combined with distinctly lower (than at higher levels of moisture<br />
content) grain-on-grain coefficient of friction.<br />
Angle of interm al friction ϕ (deg)<br />
36<br />
32<br />
28<br />
24<br />
20<br />
9 10 11 12 13 14 15 16 17 18 19 20<br />
Moisture content (%)<br />
Fig. 7.3. Mean values and 95% confidence intervals of the angle of internal friction of wheat<br />
determined with the direct shear test and the triaxial compression test


