Part III: Flare Reduction Project Family - IPIECA
Part III: Flare Reduction Project Family - IPIECA
Part III: Flare Reduction Project Family - IPIECA

Create successful ePaper yourself
Turn your PDF publications into a flip-book with our unique Google optimized e-Paper software.
Section 7. <strong>Flare</strong> <strong>Reduction</strong> <strong>Project</strong> <strong>Family</strong><br />
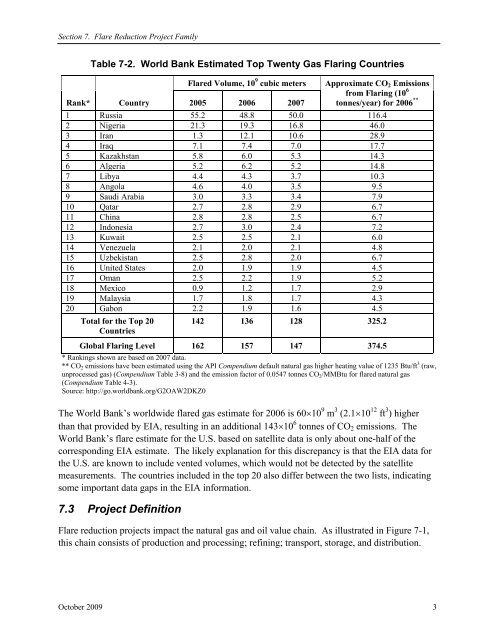
Table 7-2. World Bank Estimated Top Twenty Gas Flaring Countries<br />
<strong>Flare</strong>d Volume, 10 9 cubic meters Approximate CO 2 Emissions<br />
Rank* Country 2005 2006 2007<br />
from Flaring (10 6<br />
tonnes/year) for 2006 **<br />
1 Russia 55.2 48.8 50.0 116.4<br />
2 Nigeria 21.3 19.3 16.8 46.0<br />
3 Iran 1.3 12.1 10.6 28.9<br />
4 Iraq 7.1 7.4 7.0 17.7<br />
5 Kazakhstan 5.8 6.0 5.3 14.3<br />
6 Algeria 5.2 6.2 5.2 14.8<br />
7 Libya 4.4 4.3 3.7 10.3<br />
8 Angola 4.6 4.0 3.5 9.5<br />
9 Saudi Arabia 3.0 3.3 3.4 7.9<br />
10 Qatar 2.7 2.8 2.9 6.7<br />
11 China 2.8 2.8 2.5 6.7<br />
12 Indonesia 2.7 3.0 2.4 7.2<br />
13 Kuwait 2.5 2.5 2.1 6.0<br />
14 Venezuela 2.1 2.0 2.1 4.8<br />
15 Uzbekistan 2.5 2.8 2.0 6.7<br />
16 United States 2.0 1.9 1.9 4.5<br />
17 Oman 2.5 2.2 1.9 5.2<br />
18 Mexico 0.9 1.2 1.7 2.9<br />
19 Malaysia 1.7 1.8 1.7 4.3<br />
20 Gabon 2.2 1.9 1.6 4.5<br />
Total for the Top 20<br />
Countries<br />
142 136 128 325.2<br />
Global Flaring Level 162 157 147 374.5<br />
* Rankings shown are based on 2007 data.<br />
** CO 2 emissions have been estimated using the API Compendium default natural gas higher heating value of 1235 Btu/ft 3 (raw,<br />
unprocessed gas) (Compendium Table 3-8) and the emission factor of 0.0547 tonnes CO 2 /MMBtu for flared natural gas<br />
(Compendium Table 4-3).<br />
Source: http://go.worldbank.org/G2OAW2DKZ0<br />
The World Bank’s worldwide flared gas estimate for 2006 is 60×10 9 m 3 (2.1×10 12 ft 3 ) higher<br />
than that provided by EIA, resulting in an additional 143×10 6 tonnes of CO 2 emissions. The<br />
World Bank’s flare estimate for the U.S. based on satellite data is only about one-half of the<br />
corresponding EIA estimate. The likely explanation for this discrepancy is that the EIA data for<br />
the U.S. are known to include vented volumes, which would not be detected by the satellite<br />
measurements. The countries included in the top 20 also differ between the two lists, indicating<br />
some important data gaps in the EIA information.<br />
7.3 <strong>Project</strong> Definition<br />
<strong>Flare</strong> reduction projects impact the natural gas and oil value chain. As illustrated in Figure 7-1,<br />
this chain consists of production and processing; refining; transport, storage, and distribution.<br />
October 2009 3