2011 Annual Report - Italcementi Group
2011 Annual Report - Italcementi Group
2011 Annual Report - Italcementi Group

You also want an ePaper? Increase the reach of your titles
YUMPU automatically turns print PDFs into web optimized ePapers that Google loves.
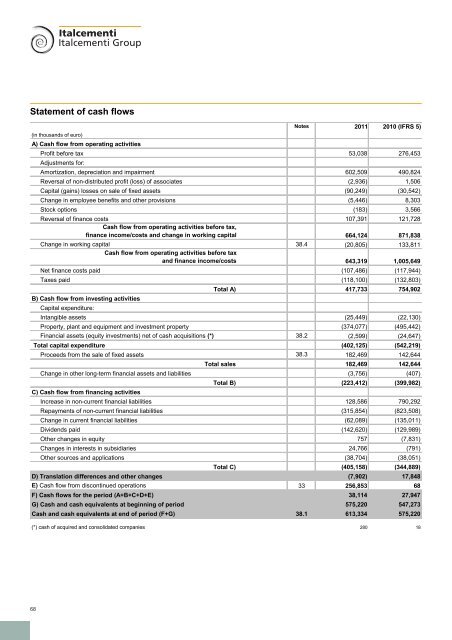
Statement of cash flows<br />
Notes <strong>2011</strong> 2010 (IFRS 5)<br />
(in thousands of euro)<br />
A) Cash flow from operating activities<br />
Profit before tax 53,038 276,453<br />
Adjustments for:<br />
Amortization, depreciation and impairment 602,509 490,824<br />
Reversal of non-distributed profit (loss) of associates (2,936) 1,506<br />
Capital (gains) losses on sale of fixed assets (90,249) (30,542)<br />
Change in employee benefits and other provisions (5,446) 8,303<br />
Stock options (183) 3,566<br />
Reversal of finance costs 107,391 121,728<br />
Cash flow from operating activities before tax,<br />
finance income/costs and change in working capital 664,124 871,838<br />
Change in working capital 38.4 (20,805) 133,811<br />
Cash flow from operating activities before tax<br />
and finance income/costs 643,319 1,005,649<br />
Net finance costs paid (107,486) (117,944)<br />
Taxes paid (118,100) (132,803)<br />
Total A) 417,733 754,902<br />
B) Cash flow from investing activities<br />
Capital expenditure:<br />
Intangible assets (25,449) (22,130)<br />
Property, plant and equipment and investment property (374,077) (495,442)<br />
Financial assets (equity investments) net of cash acquisitions (*) 38.2 (2,599) (24,647)<br />
Total capital expenditure (402,125) (542,219)<br />
Proceeds from the sale of fixed assets 38.3 182,469 142,644<br />
Total sales 182,469 142,644<br />
Change in other long-term financial assets and liabilities (3,756) (407)<br />
Total B) (223,412) (399,982)<br />
C) Cash flow from financing activities<br />
Increase in non-current financial liabilities 128,586 790,292<br />
Repayments of non-current financial liabilities (315,854) (823,508)<br />
Change in current financial liabilities (62,089) (135,011)<br />
Dividends paid (142,620) (129,989)<br />
Other changes in equity 757 (7,831)<br />
Changes in interests in subsidiaries 24,766 (791)<br />
Other sources and applications (38,704) (38,051)<br />
Total C) (405,158) (344,889)<br />
D) Translation differences and other changes (7,902) 17,848<br />
E) Cash flow from discontinued operations 33 256,853 68<br />
F) Cash flows for the period (A+B+C+D+E) 38,114 27,947<br />
G) Cash and cash equivalents at beginning of period 575,220 547,273<br />
Cash and cash equivalents at end of period (F+G) 38.1 613,334 575,220<br />
(*) cash of acquired and consolidated companies 280 18<br />
68