palfinger at a glance
palfinger at a glance
palfinger at a glance

You also want an ePaper? Increase the reach of your titles
YUMPU automatically turns print PDFs into web optimized ePapers that Google loves.
Str<strong>at</strong>egy and Value Management<br />
<strong>palfinger</strong> <strong>at</strong> a Glance<br />
> search Print<br />
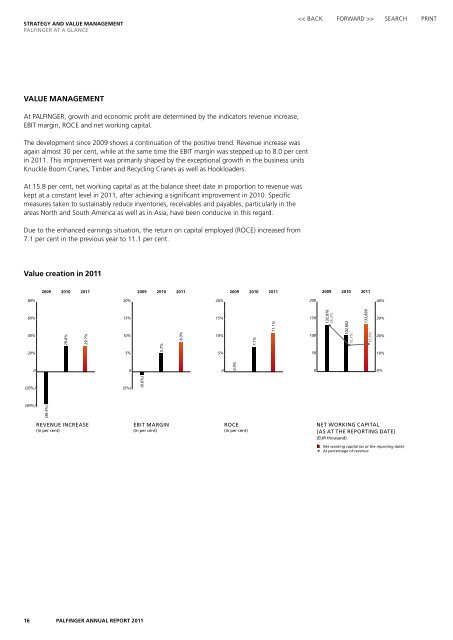
Value Management<br />
At PALFINGER, growth and economic profit are determined by the indic<strong>at</strong>ors revenue increase,<br />
EBIT margin, ROCE and net working capital.<br />
The development since 2009 shows a continu<strong>at</strong>ion of the positive trend. Revenue increase was<br />
again almost 30 per cent, while <strong>at</strong> the same time the EBIT margin was stepped up to 8.0 per cent<br />
in 2011. This improvement was primarily shaped by the exceptional growth in the business units<br />
Knuckle Boom Cranes, Timber and Recycling Cranes as well as Hookloaders.<br />
At 15.8 per cent, net working capital as <strong>at</strong> the balance sheet d<strong>at</strong>e in proportion to revenue was<br />
kept <strong>at</strong> a constant level in 2011, after achieving a significant improvement in 2010. Specific<br />
measures taken to sustainably reduce inventories, receivables and payables, particularly in the<br />
areas North and South America as well as in Asia, have been conducive in this regard.<br />
Due to the enhanced earnings situ<strong>at</strong>ion, the return on capital employed (ROCE) increased from<br />
7.1 per cent in the previous year to 11.1 per cent.<br />
Value cre<strong>at</strong>ion in 2011<br />
2009 2010 2011<br />
2009 2010 2011<br />
2009 2010 2011<br />
2009 2010 2011<br />
80%<br />
20%<br />
20%<br />
200<br />
40%<br />
60%<br />
40%<br />
20%<br />
29.0%<br />
29.7%<br />
15%<br />
10%<br />
5%<br />
5.7%<br />
8.0%<br />
15%<br />
10%<br />
5%<br />
7.1%<br />
11.1%<br />
150<br />
100<br />
50<br />
132,876<br />
26.3%<br />
102,602<br />
15.7%<br />
133,899<br />
15.8%<br />
30%<br />
20%<br />
10%<br />
0<br />
0<br />
0<br />
0.0%<br />
0<br />
0%<br />
(20%)<br />
(5%)<br />
(0.6%)<br />
(40%)<br />
(36.4%)<br />
Revenue increase<br />
(in per cent)<br />
EBit margin<br />
(in per cent)<br />
ROCE<br />
(in per cent)<br />
Net working capital<br />
(as <strong>at</strong> the reporting d<strong>at</strong>e)<br />
(EUR thousand)<br />
Net working capital (as <strong>at</strong> the reporting d<strong>at</strong>e)<br />
As percentage of revenue<br />
16 <strong>palfinger</strong> Annual Report 2011