palfinger at a glance
palfinger at a glance
palfinger at a glance

Create successful ePaper yourself
Turn your PDF publications into a flip-book with our unique Google optimized e-Paper software.
search Print<br />
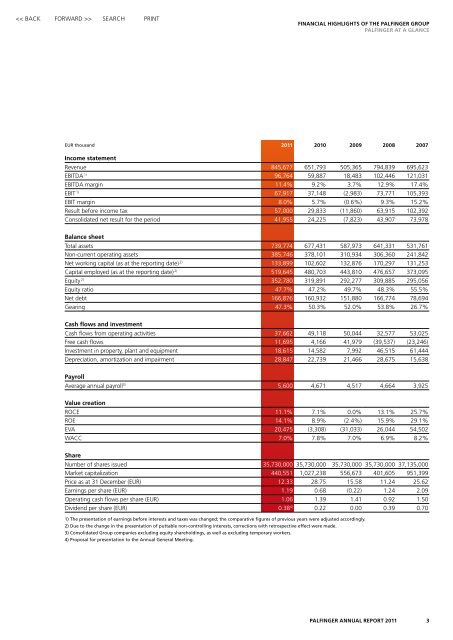
Financial Highlights of the PALFINGER Group<br />
<strong>palfinger</strong> <strong>at</strong> a Glance<br />
EUR thousand 2011 2010 2009 2008 2007<br />
Income st<strong>at</strong>ement<br />
Revenue 845,677 651,793 505,365 794,839 695,623<br />
EBITDA 1) 96,764 59,887 18,483 102,446 121,031<br />
EBITDA margin 11.4% 9.2% 3.7% 12.9% 17.4%<br />
EBIT 1) 67,917 37,148 (2,983) 73,771 105,393<br />
EBIT margin 8.0% 5.7% (0.6%) 9.3% 15.2%<br />
Result before income tax 57,000 29,833 (11,860) 63,915 102,392<br />
Consolid<strong>at</strong>ed net result for the period 41,955 24,225 (7,823) 43,907 73,978<br />
Balance sheet<br />
Total assets 739,774 677,431 587,973 641,331 531,761<br />
Non-current oper<strong>at</strong>ing assets 385,746 378,101 310,934 306,360 241,842<br />
Net working capital (as <strong>at</strong> the reporting d<strong>at</strong>e) 2) 133,899 102,602 132,876 170,297 131,253<br />
Capital employed (as <strong>at</strong> the reporting d<strong>at</strong>e) 2) 519,645 480,703 443,810 476,657 373,095<br />
Equity 2) 352,780 319,891 292,277 309,885 295,056<br />
Equity r<strong>at</strong>io 47.7% 47.2% 49.7% 48.3% 55.5%<br />
Net debt 166,876 160,932 151,880 166,774 78,694<br />
Gearing 47.3% 50.3% 52.0% 53.8% 26.7%<br />
Cash flows and investment<br />
Cash flows from oper<strong>at</strong>ing activities 37,662 49,118 50,044 32,577 53,025<br />
Free cash flows 11,695 4,166 41,979 (39,537) (23,246)<br />
Investment in property, plant and equipment 18,615 14,582 7,992 46,515 61,444<br />
Depreci<strong>at</strong>ion, amortiz<strong>at</strong>ion and impairment 28,847 22,739 21,466 28,675 15,638<br />
Payroll<br />
Average annual payroll 3) 5,600 4,671 4,517 4,664 3,925<br />
Value cre<strong>at</strong>ion<br />
ROCE 11.1% 7.1% 0.0% 13.1% 25.7%<br />
ROE 14.1% 8.9% (2.4%) 15.9% 29.1%<br />
EVA 20,475 (3,308) (31,033) 26,044 54,502<br />
wacc 7.0% 7.8% 7.0% 6.9% 8.2%<br />
Share<br />
Number of shares issued 35,730,000 35,730,000 35,730,000 35,730,000 37,135,000<br />
Market capitaliz<strong>at</strong>ion 440,551 1,027,238 556,673 401,605 951,399<br />
Price as <strong>at</strong> 31 December (EUR) 12.33 28.75 15.58 11.24 25.62<br />
Earnings per share (EUR) 1.19 0.68 (0.22) 1.24 2.09<br />
Oper<strong>at</strong>ing cash flows per share (EUR) 1.06 1.39 1.41 0.92 1.50<br />
Dividend per share (EUR) 0.38 4) 0.22 0.00 0.39 0.70<br />
1) The present<strong>at</strong>ion of earnings before interests and taxes was changed; the compar<strong>at</strong>ive figures of previous years were adjusted accordingly.<br />
2) Due to the change in the present<strong>at</strong>ion of puttable non-controlling interests, corrections with retrospective effect were made.<br />
3) Consolid<strong>at</strong>ed Group companies excluding equity shareholdings, as well as excluding temporary workers.<br />
4) Proposal for present<strong>at</strong>ion to the Annual General Meeting.<br />
<strong>palfinger</strong> Annual Report 2011<br />
3