as at December 31, 2003 - EFG Bank Group
as at December 31, 2003 - EFG Bank Group
as at December 31, 2003 - EFG Bank Group

Create successful ePaper yourself
Turn your PDF publications into a flip-book with our unique Google optimized e-Paper software.
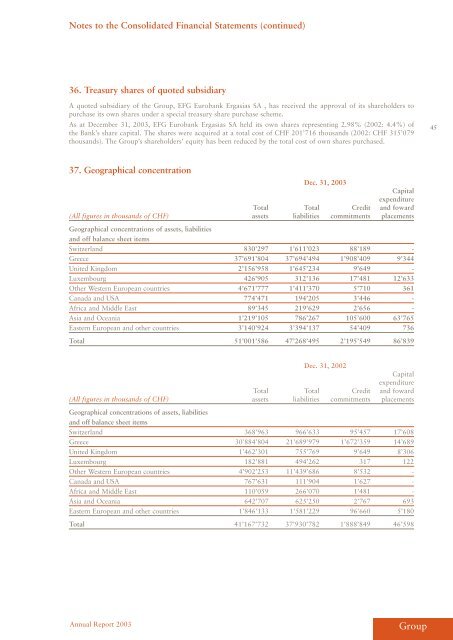
Notes to the Consolid<strong>at</strong>ed Financial St<strong>at</strong>ements (continued)<br />
36. Tre<strong>as</strong>ury shares of quoted subsidiary<br />
A quoted subsidiary of the <strong>Group</strong>, <strong>EFG</strong> Eurobank Erg<strong>as</strong>i<strong>as</strong> SA , h<strong>as</strong> received the approval of its shareholders to<br />
purch<strong>as</strong>e its own shares under a special tre<strong>as</strong>ury share purch<strong>as</strong>e scheme.<br />
As <strong>at</strong> <strong>December</strong> <strong>31</strong>, <strong>2003</strong>, <strong>EFG</strong> Eurobank Erg<strong>as</strong>i<strong>as</strong> SA held its own shares representing 2.98% (2002: 4.4%) of<br />
the <strong>Bank</strong>’s share capital. The shares were acquired <strong>at</strong> a total cost of CHF 201’716 thousands (2002: CHF <strong>31</strong>5’079<br />
thousands). The <strong>Group</strong>’s shareholders’ equity h<strong>as</strong> been reduced by the total cost of own shares purch<strong>as</strong>ed.<br />
37. Geographical concentr<strong>at</strong>ion<br />
Dec. <strong>31</strong>, <strong>2003</strong><br />
Total Total Credit<br />
Capital<br />
expenditure<br />
and foward<br />
(All figures in thousands of CHF) <strong>as</strong>sets liabilities commitments placements<br />
Geographical concentr<strong>at</strong>ions of <strong>as</strong>sets, liabilities<br />
and off balance sheet items<br />
Switzerland 830’297 1’611’023 88’189 -<br />
Greece 37’691’804 37’694’494 1’908’409 9’344<br />
United Kingdom 2’156’958 1’645’234 9’649 -<br />
Luxembourg 426’905 <strong>31</strong>2’136 17’481 12’633<br />
Other Western European countries 4’671’777 1’411’370 5’710 361<br />
Canada and USA 774’471 194’205 3’446 -<br />
Africa and Middle E<strong>as</strong>t 89’345 219’629 2’656 -<br />
Asia and Oceania 1’219’105 786’267 105’600 63’765<br />
E<strong>as</strong>tern European and other countries 3’140’924 3’394’137 54’409 736<br />
Total 51’001’586 47’268’495 2’195’549 86’839<br />
Dec. <strong>31</strong>, 2002<br />
Total Total Credit<br />
Capital<br />
expenditure<br />
and foward<br />
(All figures in thousands of CHF) <strong>as</strong>sets liabilities commitments placements<br />
Geographical concentr<strong>at</strong>ions of <strong>as</strong>sets, liabilities<br />
and off balance sheet items<br />
Switzerland 368’963 966’633 95’457 17’608<br />
Greece 30’884’804 21’689’979 1’672’359 14’689<br />
United Kingdom 1’462’301 755’769 9’649 8’306<br />
Luxembourg 182’881 494’262 <strong>31</strong>7 122<br />
Other Western European countries 4’902’253 11’439’686 8’532 -<br />
Canada and USA 767’6<strong>31</strong> 111’904 1’627 -<br />
Africa and Middle E<strong>as</strong>t 110’059 266’070 1’481 -<br />
Asia and Oceania 642’707 625’250 2’767 693<br />
E<strong>as</strong>tern European and other countries 1’846’133 1’581’229 96’660 5’180<br />
Total 41’167’732 37’930’782 1’888’849 46’598<br />
Annual Report <strong>2003</strong><br />
<strong>Group</strong><br />
45