as at December 31, 2003 - EFG Bank Group
as at December 31, 2003 - EFG Bank Group
as at December 31, 2003 - EFG Bank Group

You also want an ePaper? Increase the reach of your titles
YUMPU automatically turns print PDFs into web optimized ePapers that Google loves.
50<br />
Notes to the Consolid<strong>at</strong>ed Financial St<strong>at</strong>ements (continued)<br />
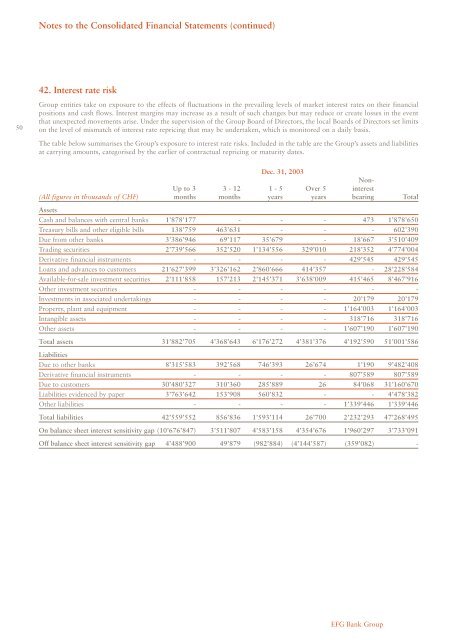
42. Interest r<strong>at</strong>e risk<br />
<strong>Group</strong> entities take on exposure to the effects of fluctu<strong>at</strong>ions in the prevailing levels of market interest r<strong>at</strong>es on their financial<br />
positions and c<strong>as</strong>h flows. Interest margins may incre<strong>as</strong>e <strong>as</strong> a result of such changes but may reduce or cre<strong>at</strong>e losses in the event<br />
th<strong>at</strong> unexpected movements arise. Under the supervision of the <strong>Group</strong> Board of Directors, the local Boards of Directors set limits<br />
on the level of mism<strong>at</strong>ch of interest r<strong>at</strong>e repricing th<strong>at</strong> may be undertaken, which is monitored on a daily b<strong>as</strong>is.<br />
The table below summarises the <strong>Group</strong>’s exposure to interest r<strong>at</strong>e risks. Included in the table are the <strong>Group</strong>’s <strong>as</strong>sets and liabilities<br />
<strong>at</strong> carrying amounts, c<strong>at</strong>egorised by the earlier of contractual repricing or m<strong>at</strong>urity d<strong>at</strong>es.<br />
Dec. <strong>31</strong>, <strong>2003</strong><br />
Up to 3 3 - 12 1 - 5 Over 5<br />
Noninterest<br />
(All figures in thousands of CHF) months months years years bearing Total<br />
Assets<br />
C<strong>as</strong>h and balances with central banks 1’878’177 - - - 473 1’878’650<br />
Tre<strong>as</strong>ury bills and other eligible bills 138’759 463’6<strong>31</strong> - - - 602’390<br />
Due from other banks 3’386’946 69’117 35’679 - 18’667 3’510’409<br />
Trading securities 2’739’566 352’520 1’134’556 329’010 218’352 4’774’004<br />
Deriv<strong>at</strong>ive financial instruments - - - - 429’545 429’545<br />
Loans and advances to customers 21’627’399 3’326’162 2’860’666 414’357 - 28’228’584<br />
Available-for-sale investment securities 2’111’858 157’213 2’145’371 3’638’009 415’465 8’467’916<br />
Other investment securities - - - - - -<br />
Investments in <strong>as</strong>soci<strong>at</strong>ed undertakings - - - - 20’179 20’179<br />
Property, plant and equipment - - - - 1’164’003 1’164’003<br />
Intangible <strong>as</strong>sets - - - - <strong>31</strong>8’716 <strong>31</strong>8’716<br />
Other <strong>as</strong>sets - - - - 1’607’190 1’607’190<br />
Total <strong>as</strong>sets <strong>31</strong>’882’705 4’368’643 6’176’272 4’381’376 4’192’590 51’001’586<br />
Liabilities<br />
Due to other banks 8’<strong>31</strong>5’583 392’568 746’393 26’674 1’190 9’482’408<br />
Deriv<strong>at</strong>ive financial instruments - - - - 807’589 807’589<br />
Due to customers 30’480’327 <strong>31</strong>0’360 285’889 26 84’068 <strong>31</strong>’160’670<br />
Liabilities evidenced by paper 3’763’642 153’908 560’832 - - 4’478’382<br />
Other liabilities - - - - 1’339’446 1’339’446<br />
Total liabilities 42’559’552 856’836 1’593’114 26’700 2’232’293 47’268’495<br />
On balance sheet interest sensitivity gap (10’676’847) 3’511’807 4’583’158 4’354’676 1’960’297 3’733’091<br />
Off balance sheet interest sensitivity gap 4’488’900 49’879 (982’884) (4’144’587) (359’082) -<br />
<strong>EFG</strong> <strong>Bank</strong> <strong>Group</strong>