as at December 31, 2003 - EFG Bank Group
as at December 31, 2003 - EFG Bank Group
as at December 31, 2003 - EFG Bank Group

Create successful ePaper yourself
Turn your PDF publications into a flip-book with our unique Google optimized e-Paper software.
Notes to the Consolid<strong>at</strong>ed Financial St<strong>at</strong>ements (continued)<br />
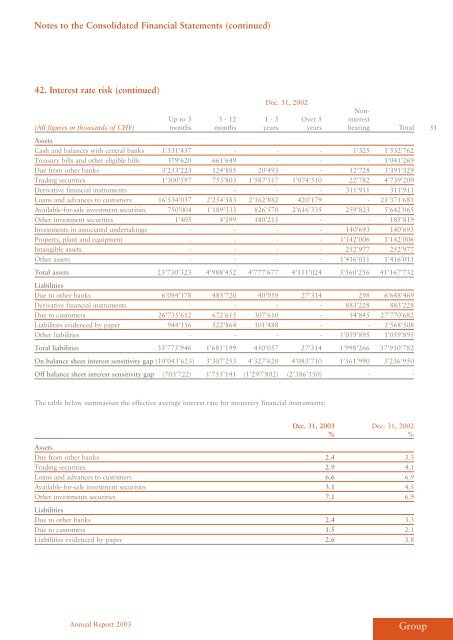
42. Interest r<strong>at</strong>e risk (continued)<br />
Dec. <strong>31</strong>, 2002<br />
Up to 3 3 - 12 1 - 5 Over 5<br />
Noninterest<br />
(All figures in thousands of CHF) months months years years bearing Total<br />
Assets<br />
C<strong>as</strong>h and balances with central banks 1’5<strong>31</strong>’437 - - - 1’325 1’532’762<br />
Tre<strong>as</strong>ury bills and other eligible bills 379’620 661’649 - - - 1’041’269<br />
Due from other banks 3’233’223 124’885 20’493 - 12’728 3’391’329<br />
Trading securities 1’300’597 753’803 1’587’517 1’074’510 22’782 4’739’209<br />
Deriv<strong>at</strong>ive financial instruments - - - - <strong>31</strong>1’911 <strong>31</strong>1’911<br />
Loans and advances to customers 16’534’037 2’254’583 2’162’882 420’179 - 21’371’681<br />
Available-for-sale investment securities 750’004 1’189’333 826’570 2’616’335 259’823 5’642’065<br />
Other investment securities 1’405 4’199 180’215 - - 185’819<br />
Investments in <strong>as</strong>soci<strong>at</strong>ed undertakings - - - - 140’693 140’693<br />
Property, plant and equipment - - - - 1’142’006 1’142’006<br />
Intangible <strong>as</strong>sets - - - - 252’977 252’977<br />
Other <strong>as</strong>sets - - - - 1’416’011 1’416’011<br />
Total <strong>as</strong>sets 23’730’323 4’988’452 4’777’677 4’111’024 3’560’256 41’167’732<br />
Liabilities<br />
Due to other banks 6’094’178 485’720 40’959 27’<strong>31</strong>4 298 6’648’469<br />
Deriv<strong>at</strong>ive financial instruments - - - - 883’228 883’228<br />
Due to customers 26’735’612 672’615 307’610 - 54’845 27’770’682<br />
Liabilities evidenced by paper 944’156 522’864 101’488 - - 1’568’508<br />
Other liabilities - - - - 1’059’895 1’059’895<br />
Total liabilities 33’773’946 1’681’199 450’057 27’<strong>31</strong>4 1’998’266 37’930’782<br />
On balance sheet interest sensitivity gap (10’043’623) 3’307’253 4’327’620 4’083’710 1’561’990 3’236’950<br />
Off balance sheet interest sensitivity gap (703’722) 1’755’141 (1’297’802) (2’386’150) - -<br />
The table below summarises the effective average interest r<strong>at</strong>e for monetary financial instruments:<br />
Annual Report <strong>2003</strong><br />
Dec. <strong>31</strong>, <strong>2003</strong> Dec. <strong>31</strong>, 2002<br />
% %<br />
Assets<br />
Due from other banks 2.4 3.3<br />
Trading securities 2.9 4.1<br />
Loans and advances to customers 6.6 6.9<br />
Available-for-sale investment securities 3.1 4.5<br />
Other investments securities 7.1 6.9<br />
Liabilities<br />
Due to other banks 2.4 3.3<br />
Due to customers 1.5 2.1<br />
Liabilities evidenced by paper 2.6 3.8<br />
<strong>Group</strong><br />
51