as at December 31, 2003 - EFG Bank Group
as at December 31, 2003 - EFG Bank Group
as at December 31, 2003 - EFG Bank Group

You also want an ePaper? Increase the reach of your titles
YUMPU automatically turns print PDFs into web optimized ePapers that Google loves.
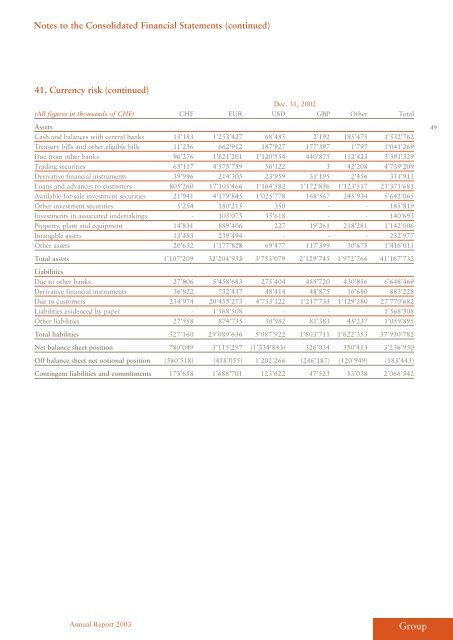
Notes to the Consolid<strong>at</strong>ed Financial St<strong>at</strong>ements (continued)<br />
41. Currency risk (continued)<br />
Dec. <strong>31</strong>, 2002<br />
(All figures in thousands of CHF) CHF EUR USD GBP Other Total<br />
Assets<br />
C<strong>as</strong>h and balances with central banks 13’183 1’253’427 68’485 2’192 195’475 1’532’762<br />
Tre<strong>as</strong>ury bills and other eligible bills 11’236 662’912 187’927 177’397 1’797 1’041’269<br />
Due from other banks 96’276 1’621’201 1’120’554 440’875 112’423 3’391’329<br />
Trading securities 65’117 4’575’759 56’122 3 42’208 4’739’209<br />
Deriv<strong>at</strong>ive financial instruments 39’996 214’305 23’959 <strong>31</strong>’195 2’456 <strong>31</strong>1’911<br />
Loans and advances to customers 805’260 17’105’466 1’164’582 1’172’856 1’123’517 21’371’681<br />
Available-for-sale investment securities 21’941 4’179’845 1’025’778 168’567 245’934 5’642’065<br />
Other investment securities 5’254 180’215 350 - - 185’819<br />
Investments in <strong>as</strong>soci<strong>at</strong>ed undertakings - 105’075 35’618 - - 140’693<br />
Property, plant and equipment 14’8<strong>31</strong> 889’406 227 19’261 218’281 1’142’006<br />
Intangible <strong>as</strong>sets 13’483 239’494 - - - 252’977<br />
Other <strong>as</strong>sets 20’632 1’177’828 69’477 117’399 30’675 1’416’011<br />
Total <strong>as</strong>sets 1’107’209 32’204’933 3’753’079 2’129’745 1’972’766 41’167’732<br />
Liabilities<br />
Due to other banks 27’806 5’458’683 275’404 455’720 430’856 6’648’469<br />
Deriv<strong>at</strong>ive financial instruments 36’822 732’437 48’414 48’875 16’680 883’228<br />
Due to customers 234’974 20’455’273 4’733’122 1’217’733 1’129’580 27’770’682<br />
Liabilities evidenced by paper - 1’568’508 - - - 1’568’508<br />
Other liabilities 27’558 874’735 30’982 81’383 45’237 1’059’895<br />
Total liabilities 327’160 29’089’636 5’087’922 1’803’711 1’622’353 37’930’782<br />
Net balance sheet position 780’049 3’115’297 (1’334’843) 326’034 350’413 3’236’950<br />
Off balance sheet net notional position (560’518) (458’055) 1’202’266 (246’187) (120’949) (183’443)<br />
Contingent liabilities and commitments 173’658 1’688’701 123’622 47’523 33’038 2’066’542<br />
Annual Report <strong>2003</strong><br />
<strong>Group</strong><br />
49