as at December 31, 2003 - EFG Bank Group
as at December 31, 2003 - EFG Bank Group
as at December 31, 2003 - EFG Bank Group

You also want an ePaper? Increase the reach of your titles
YUMPU automatically turns print PDFs into web optimized ePapers that Google loves.
Notes to the Consolid<strong>at</strong>ed Financial St<strong>at</strong>ements (continued)<br />
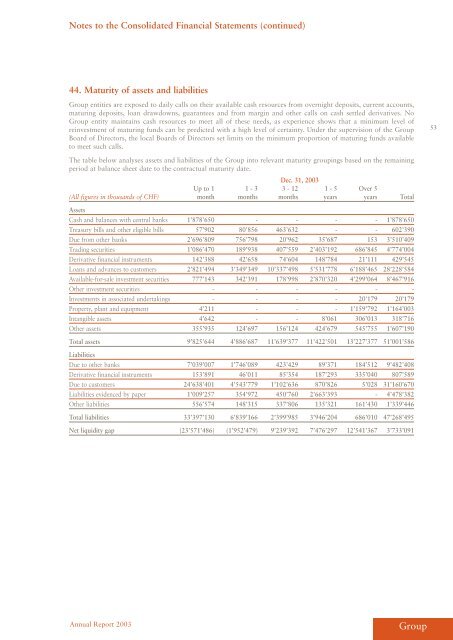
44. M<strong>at</strong>urity of <strong>as</strong>sets and liabilities<br />
<strong>Group</strong> entities are exposed to daily calls on their available c<strong>as</strong>h resources from overnight deposits, current accounts,<br />
m<strong>at</strong>uring deposits, loan drawdowns, guarantees and from margin and other calls on c<strong>as</strong>h settled deriv<strong>at</strong>ives. No<br />
<strong>Group</strong> entity maintains c<strong>as</strong>h resources to meet all of these needs, <strong>as</strong> experience shows th<strong>at</strong> a minimum level of<br />
reinvestment of m<strong>at</strong>uring funds can be predicted with a high level of certainty. Under the supervision of the <strong>Group</strong><br />
Board of Directors, the local Boards of Directors set limits on the minimum proportion of m<strong>at</strong>uring funds available<br />
to meet such calls.<br />
The table below analyses <strong>as</strong>sets and liabilities of the <strong>Group</strong> into relevant m<strong>at</strong>urity groupings b<strong>as</strong>ed on the remaining<br />
period <strong>at</strong> balance sheet d<strong>at</strong>e to the contractual m<strong>at</strong>urity d<strong>at</strong>e.<br />
Dec. <strong>31</strong>, <strong>2003</strong><br />
Up to 1 1 - 3 3 - 12 1 - 5 Over 5<br />
(All figures in thousands of CHF) month months months years years Total<br />
Assets<br />
C<strong>as</strong>h and balances with central banks 1’878’650 - - - - 1’878’650<br />
Tre<strong>as</strong>ury bills and other eligible bills 57’902 80’856 463’632 - - 602’390<br />
Due from other banks 2’696’809 756’798 20’962 35’687 153 3’510’409<br />
Trading securities 1’086’470 189’938 407’559 2’403’192 686’845 4’774’004<br />
Deriv<strong>at</strong>ive financial instruments 142’388 42’658 74’604 148’784 21’111 429’545<br />
Loans and advances to customers 2’821’494 3’349’349 10’337’498 5’5<strong>31</strong>’778 6’188’465 28’228’584<br />
Available-for-sale investment securities 777’143 342’391 178’998 2’870’320 4’299’064 8’467’916<br />
Other investment securities - - - - - -<br />
Investments in <strong>as</strong>soci<strong>at</strong>ed undertakings - - - - 20’179 20’179<br />
Property, plant and equipment 4’211 - - - 1’159’792 1’164’003<br />
Intangible <strong>as</strong>sets 4’642 - - 8’061 306’013 <strong>31</strong>8’716<br />
Other <strong>as</strong>sets 355’935 124’697 156’124 424’679 545’755 1’607’190<br />
Total <strong>as</strong>sets 9’825’644 4’886’687 11’639’377 11’422’501 13’227’377 51’001’586<br />
Liabilities<br />
Due to other banks 7’039’007 1’746’089 423’429 89’371 184’512 9’482’408<br />
Deriv<strong>at</strong>ive financial instruments 153’891 46’011 85’354 187’293 335’040 807’589<br />
Due to customers 24’638’401 4’543’779 1’102’636 870’826 5’028 <strong>31</strong>’160’670<br />
Liabilities evidenced by paper 1’009’257 354’972 450’760 2’663’393 - 4’478’382<br />
Other liabilities 556’574 148’<strong>31</strong>5 337’806 135’321 161’430 1’339’446<br />
Total liabilities 33’397’130 6’839’166 2’399’985 3’946’204 686’010 47’268’495<br />
Net liquidity gap (23’571’486) (1’952’479) 9’239’392 7’476’297 12’541’367 3’733’091<br />
Annual Report <strong>2003</strong><br />
<strong>Group</strong><br />
53