

2007 Annual Report - Sappi
2007 Annual Report - Sappi
2007 Annual Report - Sappi

You also want an ePaper? Increase the reach of your titles
YUMPU automatically turns print PDFs into web optimized ePapers that Google loves.
Chief financial officer’s report<br />
Introduction<br />
The objective of this report and analysis is to provide additional insight into the financial position and operating performance of the<br />
group. This report should be read in conjunction with the operational reviews on pages 22 to 30 and the group annual financial<br />
statements beginning on page 60. References to the years <strong>2007</strong>, 2006 or 2005 are for the financial years ended September of each<br />
of those years unless stated otherwise.<br />
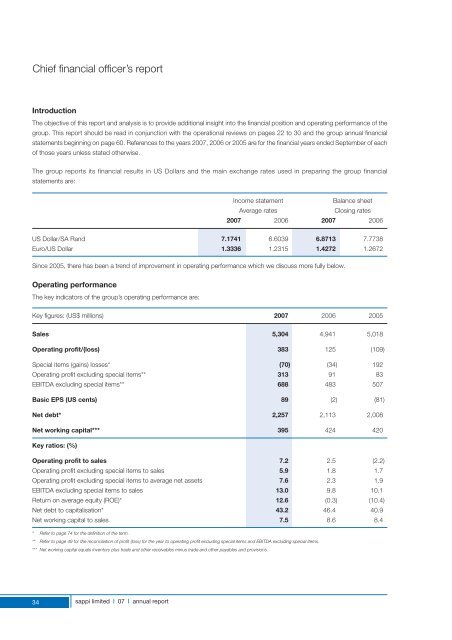
The group reports its financial results in US Dollars and the main exchange rates used in preparing the group financial<br />
statements are:<br />
Income statement<br />
Balance sheet<br />
Average rates<br />
Closing rates<br />
<strong>2007</strong> 2006 <strong>2007</strong> 2006<br />
US Dollar/SA Rand 7.1741 6.6039 6.8713 7.7738<br />
Euro/US Dollar 1.3336 1.2315 1.4272 1.2672<br />
Since 2005, there has been a trend of improvement in operating performance which we discuss more fully below.<br />
Operating performance<br />
The key indicators of the group’s operating performance are:<br />
Key figures: (US$ millions) <strong>2007</strong> 2006 2005<br />
Sales 5,304 4,941 5,018<br />
Operating profit/(loss) 383 125 (109)<br />
Special items (gains) losses* (70) (34) 192<br />
Operating profit excluding special items** 313 91 83<br />
EBITDA excluding special items** 688 483 507<br />
Basic EPS (US cents) 89 (2) (81)<br />
Net debt* 2,257 2,113 2,008<br />
Net working capital*** 395 424 420<br />
Key ratios: (%)<br />
Operating profit to sales 7.2 2.5 (2.2)<br />
Operating profit excluding special items to sales 5.9 1.8 1.7<br />
Operating profit excluding special items to average net assets 7.6 2.3 1.9<br />
EBITDA excluding special items to sales 13.0 9.8 10.1<br />
Return on average equity (ROE)* 12.6 (0.3) (10.4)<br />
Net debt to capitalisation* 43.2 46.4 40.9<br />
Net working capital to sales 7.5 8.6 8.4<br />
* Refer to page 74 for the definition of the term.<br />
** Refer to page 49 for the reconciliation of profit (loss) for the year to operating profit excluding special items and EBITDA excluding special items.<br />
*** Net working capital equals inventory plus trade and other receivables minus trade and other payables and provisions.<br />
34<br />
sappi limited | 07 | annual report


