

2007 Annual Report - Sappi
2007 Annual Report - Sappi
2007 Annual Report - Sappi

Create successful ePaper yourself
Turn your PDF publications into a flip-book with our unique Google optimized e-Paper software.
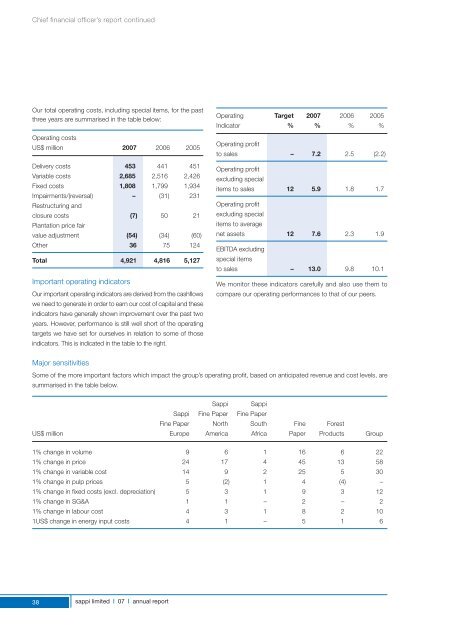
Chief financial officer’s report continued<br />
Our total operating costs, including special items, for the past<br />
three years are summarised in the table below:<br />
Operating costs<br />
US$ million <strong>2007</strong> 2006 2005<br />
Delivery costs 453 441 451<br />
Variable costs 2,685 2,516 2,426<br />
Fixed costs 1,808 1,799 1,934<br />
Impairments/(reversal) – (31) 231<br />
Restructuring and<br />
closure costs (7) 50 21<br />
Plantation price fair<br />
value adjustment (54) (34) (60)<br />
Other 36 75 124<br />
Total 4,921 4,816 5,127<br />
Important operating indicators<br />
Our important operating indicators are derived from the cashflows<br />
we need to generate in order to earn our cost of capital and these<br />
indicators have generally shown improvement over the past two<br />
years. However, performance is still well short of the operating<br />
targets we have set for ourselves in relation to some of those<br />
indicators. This is indicated in the table to the right.<br />
Operating Target <strong>2007</strong> 2006 2005<br />
Indicator % % % %<br />
Operating profit<br />
to sales – 7.2 2.5 (2.2)<br />
Operating profit<br />
excluding special<br />
items to sales 12 5.9 1.8 1.7<br />
Operating profit<br />
excluding special<br />
items to average<br />
net assets 12 7.6 2.3 1.9<br />
EBITDA excluding<br />
special items<br />
to sales – 13.0 9.8 10.1<br />
We monitor these indicators carefully and also use them to<br />
compare our operating performances to that of our peers.<br />
Major sensitivities<br />
Some of the more important factors which impact the group’s operating profit, based on anticipated revenue and cost levels, are<br />
summarised in the table below.<br />
<strong>Sappi</strong> <strong>Sappi</strong><br />
<strong>Sappi</strong> Fine Paper Fine Paper<br />
Fine Paper North South Fine Forest<br />
US$ million Europe America Africa Paper Products Group<br />
1% change in volume 9 6 1 16 6 22<br />
1% change in price 24 17 4 45 13 58<br />
1% change in variable cost 14 9 2 25 5 30<br />
1% change in pulp prices 5 (2) 1 4 (4) –<br />
1% change in fixed costs (excl. depreciation) 5 3 1 9 3 12<br />
1% change in SG&A 1 1 – 2 – 2<br />
1% change in labour cost 4 3 1 8 2 10<br />
1US$ change in energy input costs 4 1 – 5 1 6<br />
38<br />
sappi limited | 07 | annual report


