

2007 Annual Report - Sappi
2007 Annual Report - Sappi
2007 Annual Report - Sappi

You also want an ePaper? Increase the reach of your titles
YUMPU automatically turns print PDFs into web optimized ePapers that Google loves.
Chief financial officer’s report continued<br />
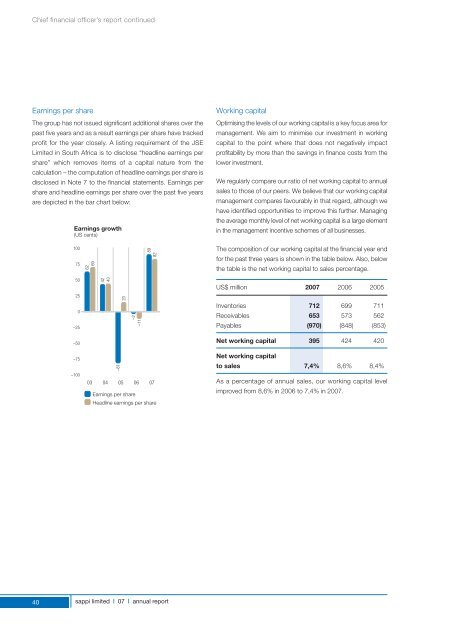
Earnings per share<br />
The group has not issued significant additional shares over the<br />
past five years and as a result earnings per share have tracked<br />
profit for the year closely. A listing requirement of the JSE<br />
Limited in South Africa is to disclose “headline earnings per<br />
share” which removes items of a capital nature from the<br />
calculation – the computation of headline earnings per share is<br />
disclosed in Note 7 to the financial statements. Earnings per<br />
share and headline earnings per share over the past five years<br />
are depicted in the bar chart below:<br />
Working capital<br />
Optimising the levels of our working capital is a key focus area for<br />
management. We aim to minimise our investment in working<br />
capital to the point where that does not negatively impact<br />
profitability by more than the savings in finance costs from the<br />
lower investment.<br />
We regularly compare our ratio of net working capital to annual<br />
sales to those of our peers. We believe that our working capital<br />
management compares favourably in that regard, although we<br />
have identified opportunities to improve this further. Managing<br />
the average monthly level of net working capital is a large element<br />
in the management incentive schemes of all businesses.<br />
The composition of our working capital at the financial year end<br />
for the past three years is shown in the table below. Also, below<br />
the table is the net working capital to sales percentage.<br />
US$ million <strong>2007</strong> 2006 2005<br />
Inventories 712 699 711<br />
Receivables 653 573 562<br />
Payables (970) (848) (853)<br />
Net working capital 395 424 420<br />
Net working capital<br />
to sales 7,4% 8,6% 8,4%<br />
As a percentage of annual sales, our working capital level<br />
improved from 8,6% in 2006 to 7,4% in <strong>2007</strong>.<br />
40<br />
sappi limited | 07 | annual report


