

2007 Annual Report - Sappi
2007 Annual Report - Sappi
2007 Annual Report - Sappi

Create successful ePaper yourself
Turn your PDF publications into a flip-book with our unique Google optimized e-Paper software.
Our performance<br />
Our performance improved significantly in the year as a result of<br />
strong performance in our South African businesses assisted by<br />
strong demand, high pulp prices as well as the weaker Rand<br />
and a return to profitability of all the fine paper divisions.<br />
Financial highlights<br />
• Steady improvement of operating performance<br />
• Basic EPS 89 US cents: last year loss of 2 US cents<br />
• Positive cash generation after capex<br />
• Input costs continued to rise<br />
• Prices improved except for <strong>Sappi</strong> Fine Paper Europe<br />
• Dividend of 32 US cents per share declared<br />
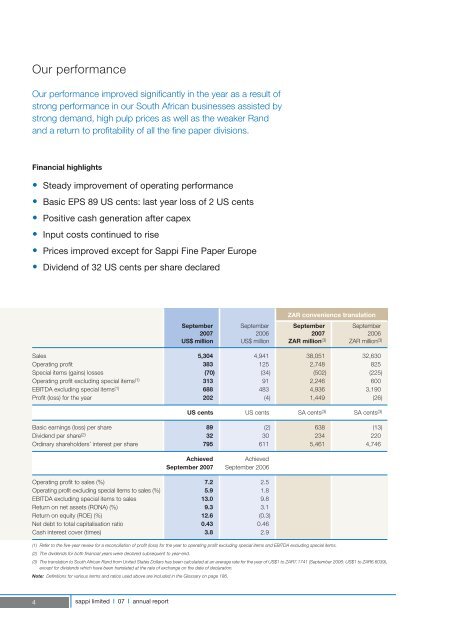
ZAR convenience translation<br />
September September September September<br />
<strong>2007</strong> 2006 <strong>2007</strong> 2006<br />
US$ million US$ million ZAR million (3) ZAR million (3)<br />
Sales 5,304 4,941 38,051 32,630<br />
Operating profit 383 125 2,748 825<br />
Special items (gains) losses (70) (34) (502) (225)<br />
Operating profit excluding special items (1) 313 91 2,246 600<br />
EBITDA excluding special items (1) 688 483 4,936 3,190<br />
Profit (loss) for the year 202 (4) 1,449 (26)<br />
US cents US cents SA cents (3) SA cents (3)<br />
Basic earnings (loss) per share 89 (2) 638 (13)<br />
Dividend per share (2) 32 30 234 220<br />
Ordinary shareholders’ interest per share 795 611 5,461 4,746<br />
Achieved<br />
Achieved<br />
September <strong>2007</strong> September 2006<br />
Operating profit to sales (%) 7.2 2.5<br />
Operating profit excluding special items to sales (%) 5.9 1.8<br />
EBITDA excluding special items to sales 13.0 9.8<br />
Return on net assets (RONA) (%) 9.3 3.1<br />
Return on equity (ROE) (%) 12.6 (0.3)<br />
Net debt to total capitalisation ratio 0.43 0.46<br />
Cash interest cover (times) 3.8 2.9<br />
(1) Refer to the five-year review for a reconciliation of profit (loss) for the year to operating profit excluding special items and EBITDA excluding special items.<br />
(2) The dividends for both financial years were declared subsequent to year-end.<br />
(3) The translation to South African Rand from United States Dollars has been calculated at an average rate for the year of US$1 to ZAR7.1741 (September 2006: US$1 to ZAR6.6039),<br />
except for dividends which have been translated at the rate of exchange on the date of declaration.<br />
Note: Definitions for various terms and ratios used above are included in the Glossary on page 186.<br />
4<br />
sappi limited | 07 | annual report


