

2007 Annual Report - Sappi
2007 Annual Report - Sappi
2007 Annual Report - Sappi

You also want an ePaper? Increase the reach of your titles
YUMPU automatically turns print PDFs into web optimized ePapers that Google loves.
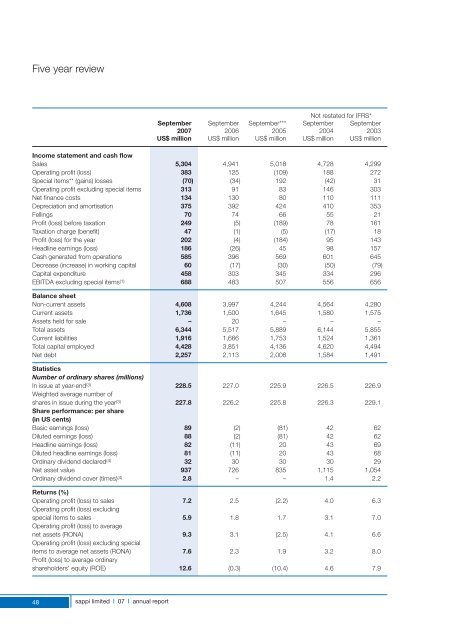
Five year review<br />
Not restated for IFRS*<br />
September September September*** September September<br />
<strong>2007</strong> 2006 2005 2004 2003<br />
US$ million US$ million US$ million US$ million US$ million<br />
Income statement and cash flow<br />
Sales 5,304 4,941 5,018 4,728 4,299<br />
Operating profit (loss) 383 125 (109) 188 272<br />
Special items** (gains) losses (70) (34) 192 (42) 31<br />
Operating profit excluding special items 313 91 83 146 303<br />
Net finance costs 134 130 80 110 111<br />
Depreciation and amortisation 375 392 424 410 353<br />
Fellings 70 74 66 55 21<br />
Profit (loss) before taxation 249 (5) (189) 78 161<br />
Taxation charge (benefit) 47 (1) (5) (17) 18<br />
Profit (loss) for the year 202 (4) (184) 95 143<br />
Headline earnings (loss) 186 (26) 45 98 157<br />
Cash generated from operations 585 396 569 601 645<br />
Decrease (increase) in working capital 60 (17) (30) (50) (79)<br />
Capital expenditure 458 303 345 334 296<br />
EBITDA excluding special items (1) 688 483 507 556 656<br />
Balance sheet<br />
Non-current assets 4,608 3,997 4,244 4,564 4,280<br />
Current assets 1,736 1,500 1,645 1,580 1,575<br />
Assets held for sale – 20 – – –<br />
Total assets 6,344 5,517 5,889 6,144 5,855<br />
Current liabilities 1,916 1,666 1,753 1,524 1,361<br />
Total capital employed 4,428 3,851 4,136 4,620 4,494<br />
Net debt 2,257 2,113 2,008 1,584 1,491<br />
Statistics<br />
Number of ordinary shares (millions)<br />
In issue at year-end (3) 228.5 227.0 225.9 226.5 226.9<br />
Weighted average number of<br />
shares in issue during the year (3) 227.8 226.2 225.8 226.3 229.1<br />
Share performance: per share<br />
(in US cents)<br />
Basic earnings (loss) 89 (2) (81) 42 62<br />
Diluted earnings (loss) 88 (2) (81) 42 62<br />
Headline earnings (loss) 82 (11) 20 43 69<br />
Diluted headline earnings (loss) 81 (11) 20 43 68<br />
Ordinary dividend declared (4) 32 30 30 30 29<br />
Net asset value 937 726 835 1,115 1,054<br />
Ordinary dividend cover (times) (4) 2.8 – – 1.4 2.2<br />
Returns (%)<br />
Operating profit (loss) to sales 7.2 2.5 (2.2) 4.0 6.3<br />
Operating profit (loss) excluding<br />
special items to sales 5.9 1.8 1.7 3.1 7.0<br />
Operating profit (loss) to average<br />
net assets (RONA) 9.3 3.1 (2.5) 4.1 6.6<br />
Operating profit (loss) excluding special<br />
items to average net assets (RONA) 7.6 2.3 1.9 3.2 8.0<br />
Profit (loss) to average ordinary<br />
shareholders’ equity (ROE) 12.6 (0.3) (10.4) 4.6 7.9<br />
48<br />
sappi limited | 07 | annual report


