

Review of Federal Funding to Florida - Office of Economic ...
Review of Federal Funding to Florida - Office of Economic ...
Review of Federal Funding to Florida - Office of Economic ...

You also want an ePaper? Increase the reach of your titles
YUMPU automatically turns print PDFs into web optimized ePapers that Google loves.
<strong>Office</strong> <strong>of</strong> <strong>Economic</strong> and Demographic Research<br />
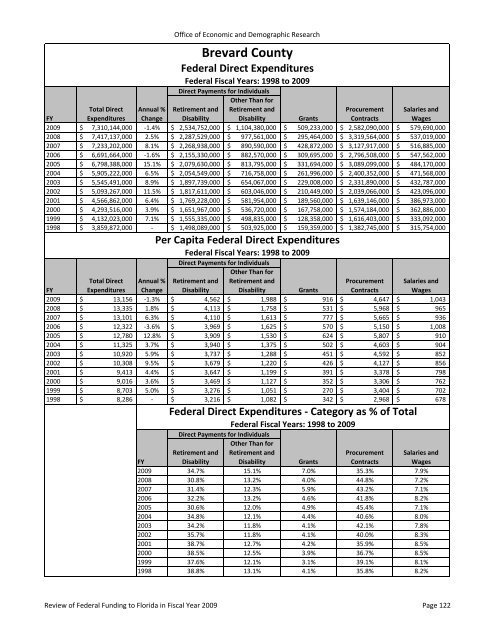
Brevard County<br />
<strong>Federal</strong> Direct Expenditures<br />
<strong>Federal</strong> Fiscal Years: 1998 <strong>to</strong> 2009<br />
Direct Payments for Individuals<br />
Other Than for<br />
FY<br />
Total Direct<br />
Expenditures<br />
Annual %<br />
Change<br />
Retirement and<br />
Disability<br />
Retirement and<br />
Disability Grants<br />
Procurement<br />
Contracts<br />
Salaries and<br />
Wages<br />
2009 $ 7,310,144,000 ‐1.4% $ 2,534,752,000 $ 1,104,380,000 $ 509,233,000 $ 2,582,090,000 $ 579,690,000<br />
2008 $ 7,417,137,000 2.5% $ 2,287,529,000 $ 977,561,000 $ 295,464,000 $ 3,319,564,000 $ 537,019,000<br />
2007 $ 7,233,202,000 8.1% $ 2,268,938,000 $ 890,590,000 $ 428,872,000 $ 3,127,917,000 $ 516,885,000<br />
2006 $ 6,691,664,000 ‐1.6% $ 2,155,330,000 $ 882,570,000 $ 309,695,000 $ 2,796,508,000 $ 547,562,000<br />
2005 $ 6,798,388,000 15.1% $ 2,079,630,000 $ 813,795,000 $ 331,694,000 $ 3,089,099,000 $ 484,170,000<br />
2004 $ 5,905,222,000 6.5% $ 2,054,549,000 $ 716,758,000 $ 261,996,000 $ 2,400,352,000 $ 471,568,000<br />
2003 $ 5,545,491,000 8.9% $ 1,897,739,000 $ 654,067,000 $ 229,008,000 $ 2,331,890,000 $ 432,787,000<br />
2002 $ 5,093,267,000 11.5% $ 1,817,611,000 $ 603,046,000 $ 210,449,000 $ 2,039,066,000 $ 423,096,000<br />
2001 $ 4,566,862,000 6.4% $ 1,769,228,000 $ 581,954,000 $ 189,560,000 $ 1,639,146,000 $ 386,973,000<br />
2000 $ 4,293,516,000 3.9% $ 1,651,967,000 $ 536,720,000 $ 167,758,000 $ 1,574,184,000 $ 362,886,000<br />
1999 $ 4,132,023,000 7.1% $ 1,555,335,000 $ 498,835,000 $ 128,358,000 $ 1,616,403,000 $ 333,092,000<br />
1998 $ 3,859,872,000 ‐ $ 1,498,089,000 $ 503,925,000 $ 159,359,000 $ 1,382,745,000 $ 315,754,000<br />
Per Capita <strong>Federal</strong> Direct Expenditures<br />
<strong>Federal</strong> Fiscal Years: 1998 <strong>to</strong> 2009<br />
Direct Payments for Individuals<br />
Other Than for<br />
FY<br />
Total Direct<br />
Expenditures<br />
Annual %<br />
Change<br />
Retirement and<br />
Disability<br />
Retirement and<br />
Disability Grants<br />
Procurement<br />
Contracts<br />
Salaries and<br />
Wages<br />
2009 $ 13,156 ‐1.3% $ 4,562 $ 1,988 $ 916 $ 4,647 $ 1,043<br />
2008 $ 13,335 1.8% $ 4,113 $ 1,758 $ 531 $ 5,968 $<br />
965<br />
2007 $ 13,101 6.3% $ 4,110 $ 1,613 $ 777 $ 5,665 $<br />
936<br />
2006 $ 12,322 ‐3.6% $ 3,969 $ 1,625 $ 570 $ 5,150 $ 1,008<br />
2005 $ 12,780 12.8% $ 3,909 $ 1,530 $ 624 $ 5,807 $<br />
910<br />
2004 $ 11,325 3.7% $ 3,940 $ 1,375 $ 502 $ 4,603 $<br />
904<br />
2003 $ 10,920 5.9% $ 3,737 $ 1,288 $ 451 $ 4,592 $<br />
852<br />
2002 $ 10,308 9.5% $ 3,679 $ 1,220 $ 426 $ 4,127 $<br />
856<br />
2001 $ 9,413 4.4% $ 3,647 $ 1,199 $ 391 $ 3,378 $<br />
798<br />
2000 $ 9,016 3.6% $ 3,469 $ 1,127 $ 352 $ 3,306 $<br />
762<br />
1999 $ 8,703 5.0% $ 3,276 $ 1,051 $ 270 $ 3,404 $<br />
702<br />
1998 $ 8,286 ‐ $ 3,216 $ 1,082 $ 342 $ 2,968 $<br />
678<br />
<strong>Federal</strong> Direct Expenditures ‐ Category as % <strong>of</strong> Total<br />
<strong>Federal</strong> Fiscal Years: 1998 <strong>to</strong> 2009<br />
Direct Payments for Individuals<br />
Other Than for<br />
Retirement and Retirement and<br />
Disability Disability<br />
Procurement<br />
FY<br />
Grants Contracts<br />
2009 34.7% 15.1% 7.0% 35.3% 7.9%<br />
2008 30.8% 13.2% 4.0% 44.8% 7.2%<br />
2007 31.4% 12.3% 5.9% 43.2% 7.1%<br />
2006 32.2% 13.2% 4.6% 41.8% 8.2%<br />
2005 30.6% 12.0% 4.9% 45.4% 7.1%<br />
2004 34.8% 12.1% 4.4% 40.6% 8.0%<br />
2003 34.2% 11.8% 4.1% 42.1% 7.8%<br />
2002 35.7% 11.8% 4.1% 40.0% 8.3%<br />
2001 38.7% 12.7% 4.2% 35.9% 8.5%<br />
2000 38.5% 12.5% 3.9% 36.7% 8.5%<br />
1999 37.6% 12.1% 3.1% 39.1% 8.1%<br />
1998 38.8% 13.1% 4.1% 35.8% 8.2%<br />
Salaries and<br />
Wages<br />
<strong>Review</strong> <strong>of</strong> <strong>Federal</strong> <strong>Funding</strong> <strong>to</strong> <strong>Florida</strong> in Fiscal Year 2009 Page 122


