<strong>Office</strong> <strong>of</strong> <strong>Economic</strong> and Demographic Research Table 1-6 <strong>Florida</strong>'s <strong>Federal</strong> Salary and Wage Expenditures <strong>Federal</strong> Fiscal Year 2009 Total <strong>Funding</strong> Per Capita <strong>Funding</strong> % <strong>of</strong> State's Rankings State's Rankings <strong>Funding</strong> Categories / Subcategories Amount Total All Populous Region Amount All Populous Region Department <strong>of</strong> Defense $ 4,863,455,000 39.8% 9th 3rd 6th $ 262.35 34th 2nd 14th Army 1,679,036,000 13.7% 17th 5th 9th 90.57 44th 5th 16th Active Military 788,093,000 6.5% 19th 4th 11th 42.51 32nd 3rd 14th Inactive Military 763,522,000 6.3% 7th 4th 3rd 41.19 46th 5th 16th Civilian 127,421,000 1.0% 20th 6th 9th 6.87 45th 6th 16th Navy 1,152,542,000 9.4% 6th 2nd 3rd 62.17 11th 2nd 6th Active Military 612,254,000 5.0% 5th 2nd 3rd 33.03 11th 2nd 6th Inactive Military 40,444,000 0.3% 4th 3rd 2nd 2.18 7th 1st 3rd * Civilian 499,844,000 4.1% 5th 2nd 3rd 26.96 11th 2nd 6th Air Force 1,925,347,000 15.8% 2nd 2nd 2nd 103.86 22nd 1st 9th Active Military 1,416,118,000 11.6% 2nd 2nd 2nd 76.39 21st 1st 8th Inactive Military 22,168,000 0.2% 3rd 2nd 2nd 1.20 40th 3rd 12th Civilian 487,061,000 4.0% 7th 4th 4th 26.27 18th 3rd 7th Other Defense: Civilian 106,530,000 0.9% 11th 5th 6th 5.75 26th 5th 10th Nondefense Agencies 7,352,004,000 60.2% 5th 4th 3rd 396.59 37th 5th 11th Department <strong>of</strong> Agriculture 120,977,000 1.0% 17th 3rd 7th 6.53 44th 5th 16th Department <strong>of</strong> Commerce 84,393,000 0.7% 7th 2nd 3rd 4.55 25th 1st 7th * Department <strong>of</strong> Education 537,000 < 0.1% 12th 7th 3rd 0.03 16th 7th 5th * Department <strong>of</strong> Energy 148,000 < 0.1% 35th 7th 12th 0.01 39th 7th 13th * Environmental Protection Agency 7,563,000 0.1% 20th 7th 6th 0.41 29th 7th 10th * <strong>Federal</strong> Deposit Insurance Corporation 10,367,000 0.1% 9th 5th 4th 0.56 37th 6th 15th General Services Administration 9,628,000 0.1% 14th 6th 5th 0.52 36th 6th 9th Department <strong>of</strong> Health and Human Services 43,421,000 0.4% 18th 7th 6th 2.34 33rd 7th 9th Department <strong>of</strong> Homeland Security 991,990,000 8.1% 4th 3rd 3rd 53.51 10th 2nd 3rd Department <strong>of</strong> Housing and Urban Development 19,662,000 0.2% 9th 7th 3rd 1.06 34th 7th 12th Department <strong>of</strong> the Interior 86,355,000 0.7% 15th 2nd 2nd 4.66 36th 3rd 11th Department <strong>of</strong> Justice 477,438,000 3.9% 5th 4th 3rd 25.75 12th 4th 7th Department <strong>of</strong> Labor 45,411,000 0.4% 7th 6th 3rd 2.45 18th 6th 7th * National Aeronautics and Space Administration 203,024,000 1.7% 6th 3rd 5th 10.95 7th 3rd 6th * National Archives and Records Administration 93,000 < 0.1% 23rd 7th 7th 0.01 24th 7th 7th * National Science Foundation - 0.0% - - - - - - - Postal Service 3,050,266,000 25.0% 4th 4th 2nd 164.54 36th 5th 10th Small Business Administration 6,545,000 0.1% 7th 4th 4th 0.35 38th 6th 12th Social Security Administration 154,990,000 1.3% 10th 6th 5th 8.36 29th 7th 14th * Department <strong>of</strong> State 38,297,000 0.3% 5th 3rd 3rd 2.07 7th 2nd 3rd Department <strong>of</strong> Transportation 274,630,000 2.2% 6th 4th 4th 14.81 21st 3rd 6th Department <strong>of</strong> the Treasury 222,893,000 1.8% 10th 5th 5th 12.02 21st 7th 8th Department <strong>of</strong> Veterans Affairs 1,463,006,000 12.0% 2nd 2nd 1st 78.92 14th 1st 6th All Other Nondefense 40,370,000 0.3% 11th 6th 5th 2.18 21st 6th 9th <strong>Review</strong> <strong>of</strong> <strong>Federal</strong> <strong>Funding</strong> <strong>to</strong> <strong>Florida</strong> in Fiscal Year 2009 Page 20
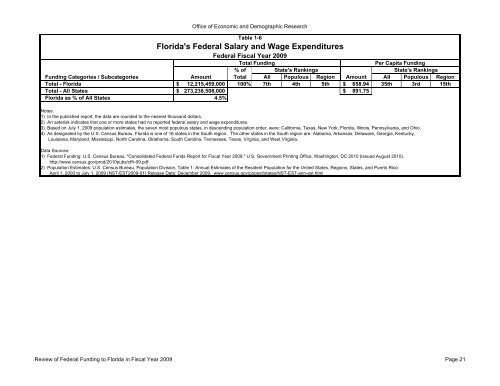
<strong>Office</strong> <strong>of</strong> <strong>Economic</strong> and Demographic Research Table 1-6 <strong>Florida</strong>'s <strong>Federal</strong> Salary and Wage Expenditures <strong>Federal</strong> Fiscal Year 2009 Total <strong>Funding</strong> Per Capita <strong>Funding</strong> % <strong>of</strong> State's Rankings State's Rankings <strong>Funding</strong> Categories / Subcategories Amount Total All Populous Region Amount All Populous Region Total - <strong>Florida</strong> $ 12,215,459,000 100% 7th 4th 5th $ 658.94 35th 3rd 15th Total - All States $ 273,238,508,000 $ 891.75 <strong>Florida</strong> as % <strong>of</strong> All States 4.5% Notes: 1) In the published report, the data are rounded <strong>to</strong> the nearest thousand dollars. 2) An asterisk indicates that one or more states had no reported federal salary and wage expenditures. 3) Based on July 1, 2009 population estimates, the seven most populous states, in descending population order, were: California, Texas, New York, <strong>Florida</strong>, Illinois, Pennsylvania, and Ohio. 4) As designated by the U.S. Census Bureau, <strong>Florida</strong> is one <strong>of</strong> 16 states in the South region. The other states in the South region are: Alabama, Arkansas, Delaware, Georgia, Kentucky, Louisiana, Maryland, Mississippi, North Carolina, Oklahoma, South Carolina, Tennessee, Texas, Virginia, and West Virginia. Data Sources: 1) <strong>Federal</strong> <strong>Funding</strong>: U.S. Census Bureau, "Consolidated <strong>Federal</strong> Funds Report for Fiscal Year 2009," U.S. Government Printing <strong>Office</strong>, Washing<strong>to</strong>n, DC 2010 (Issued August 2010). http://www.census.gov/prod/2010pubs/cffr-09.pdf 2) Population Estimates: U.S. Census Bureau, Population Division, Table 1: Annual Estimates <strong>of</strong> the Resident Population for the United States, Regions, States, and Puer<strong>to</strong> Rico: April 1, 2000 <strong>to</strong> July 1, 2009 (NST-EST2009-01) Release Date: December 2009. www.census.gov/popest/states/NST-EST-ann-est.html <strong>Review</strong> <strong>of</strong> <strong>Federal</strong> <strong>Funding</strong> <strong>to</strong> <strong>Florida</strong> in Fiscal Year 2009 Page 21