

Review of Federal Funding to Florida - Office of Economic ...
Review of Federal Funding to Florida - Office of Economic ...
Review of Federal Funding to Florida - Office of Economic ...

You also want an ePaper? Increase the reach of your titles
YUMPU automatically turns print PDFs into web optimized ePapers that Google loves.
<strong>Office</strong> <strong>of</strong> <strong>Economic</strong> and Demographic Research<br />
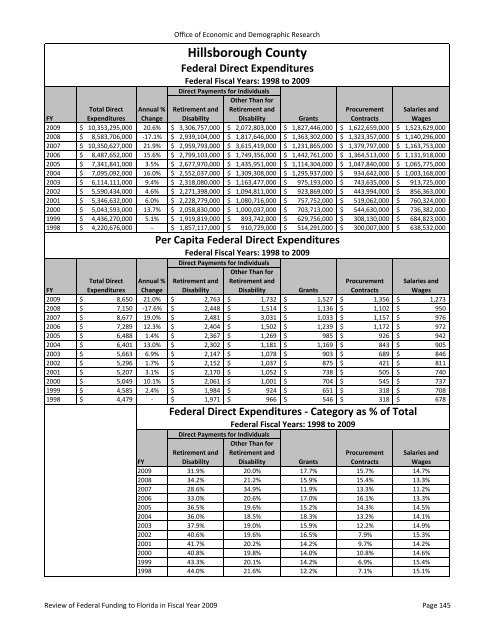
Hillsborough County<br />
<strong>Federal</strong> Direct Expenditures<br />
<strong>Federal</strong> Fiscal Years: 1998 <strong>to</strong> 2009<br />
Direct Payments for Individuals<br />
Other Than for<br />
FY<br />
Total Direct<br />
Expenditures<br />
Annual %<br />
Change<br />
Retirement and<br />
Disability<br />
Retirement and<br />
Disability Grants<br />
Procurement<br />
Contracts<br />
Salaries and<br />
Wages<br />
2009 $ 10,353,295,000 20.6% $ 3,306,757,000 $ 2,072,803,000 $ 1,827,446,000 $ 1,622,659,000 $ 1,523,629,000<br />
2008 $ 8,583,706,000 ‐17.1% $ 2,939,104,000 $ 1,817,646,000 $ 1,363,302,000 $ 1,323,357,000 $ 1,140,296,000<br />
2007 $ 10,350,627,000 21.9% $ 2,959,793,000 $ 3,615,419,000 $ 1,231,865,000 $ 1,379,797,000 $ 1,163,753,000<br />
2006 $ 8,487,652,000 15.6% $ 2,799,103,000 $ 1,749,356,000 $ 1,442,761,000 $ 1,364,513,000 $ 1,131,918,000<br />
2005 $ 7,341,841,000 3.5% $ 2,677,970,000 $ 1,435,951,000 $ 1,114,304,000 $ 1,047,840,000 $ 1,065,775,000<br />
2004 $ 7,095,092,000 16.0% $ 2,552,037,000 $ 1,309,308,000 $ 1,295,937,000 $ 934,642,000 $ 1,003,168,000<br />
2003 $ 6,114,111,000 9.4% $ 2,318,080,000 $ 1,163,477,000 $ 975,193,000 $ 743,635,000 $ 913,725,000<br />
2002 $ 5,590,434,000 4.6% $ 2,271,398,000 $ 1,094,811,000 $ 923,869,000 $ 443,994,000 $ 856,363,000<br />
2001 $ 5,346,632,000 6.0% $ 2,228,779,000 $ 1,080,716,000 $ 757,752,000 $ 519,062,000 $ 760,324,000<br />
2000 $ 5,043,593,000 13.7% $ 2,058,830,000 $ 1,000,037,000 $ 703,713,000 $ 544,630,000 $ 736,382,000<br />
1999 $ 4,436,270,000 5.1% $ 1,919,819,000 $ 893,742,000 $ 629,756,000 $ 308,130,000 $ 684,823,000<br />
1998 $ 4,220,676,000 ‐ $ 1,857,117,000 $ 910,729,000 $ 514,291,000 $ 300,007,000 $ 638,532,000<br />
Per Capita <strong>Federal</strong> Direct Expenditures<br />
<strong>Federal</strong> Fiscal Years: 1998 <strong>to</strong> 2009<br />
Direct Payments for Individuals<br />
Other Than for<br />
FY<br />
Total Direct<br />
Expenditures<br />
Annual %<br />
Change<br />
Retirement and<br />
Disability<br />
Retirement and<br />
Disability Grants<br />
Procurement<br />
Contracts<br />
Salaries and<br />
Wages<br />
2009 $ 8,650 21.0% $ 2,763 $ 1,732 $ 1,527 $ 1,356 $ 1,273<br />
2008 $ 7,150 ‐17.6% $ 2,448 $ 1,514 $ 1,136 $ 1,102 $<br />
950<br />
2007 $ 8,677 19.0% $ 2,481 $ 3,031 $ 1,033 $ 1,157 $<br />
976<br />
2006 $ 7,289 12.3% $ 2,404 $ 1,502 $ 1,239 $ 1,172 $<br />
972<br />
2005 $ 6,488 1.4% $ 2,367 $ 1,269 $ 985 $ 926 $<br />
942<br />
2004 $ 6,401 13.0% $ 2,302 $ 1,181 $ 1,169 $ 843 $<br />
905<br />
2003 $ 5,663 6.9% $ 2,147 $ 1,078 $ 903 $ 689 $<br />
846<br />
2002 $ 5,296 1.7% $ 2,152 $ 1,037 $ 875 $ 421 $<br />
811<br />
2001 $ 5,207 3.1% $ 2,170 $ 1,052 $ 738 $ 505 $<br />
740<br />
2000 $ 5,049 10.1% $ 2,061 $ 1,001 $ 704 $ 545 $<br />
737<br />
1999 $ 4,585 2.4% $ 1,984 $ 924 $ 651 $ 318 $<br />
708<br />
1998 $ 4,479 ‐ $ 1,971 $ 966 $ 546 $ 318 $<br />
678<br />
<strong>Federal</strong> Direct Expenditures ‐ Category as % <strong>of</strong> Total<br />
<strong>Federal</strong> Fiscal Years: 1998 <strong>to</strong> 2009<br />
Direct Payments for Individuals<br />
Other Than for<br />
FY<br />
Retirement and<br />
Disability<br />
Retirement and<br />
Disability Grants<br />
Procurement<br />
Contracts<br />
Salaries and<br />
Wages<br />
2009 31.9% 20.0% 17.7% 15.7% 14.7%<br />
2008 34.2% 21.2% 15.9% 15.4% 13.3%<br />
2007 28.6% 34.9% 11.9% 13.3% 11.2%<br />
2006 33.0% 20.6% 17.0% 16.1% 13.3%<br />
2005 36.5% 19.6% 15.2% 14.3% 14.5%<br />
2004 36.0% 18.5% 18.3% 13.2% 14.1%<br />
2003 37.9% 19.0% 15.9% 12.2% 14.9%<br />
2002 40.6% 19.6% 16.5% 7.9% 15.3%<br />
2001 41.7% 20.2% 14.2% 9.7% 14.2%<br />
2000 40.8% 19.8% 14.0% 10.8% 14.6%<br />
1999 43.3% 20.1% 14.2% 6.9% 15.4%<br />
1998 44.0% 21.6% 12.2% 7.1% 15.1%<br />
<strong>Review</strong> <strong>of</strong> <strong>Federal</strong> <strong>Funding</strong> <strong>to</strong> <strong>Florida</strong> in Fiscal Year 2009 Page 145


