

Review of Federal Funding to Florida - Office of Economic ...
Review of Federal Funding to Florida - Office of Economic ...
Review of Federal Funding to Florida - Office of Economic ...

Create successful ePaper yourself
Turn your PDF publications into a flip-book with our unique Google optimized e-Paper software.
<strong>Office</strong> <strong>of</strong> <strong>Economic</strong> and Demographic Research<br />
states, 7 th among the most populous states, and 15 th among the southern states. Grant obligations <strong>to</strong><br />
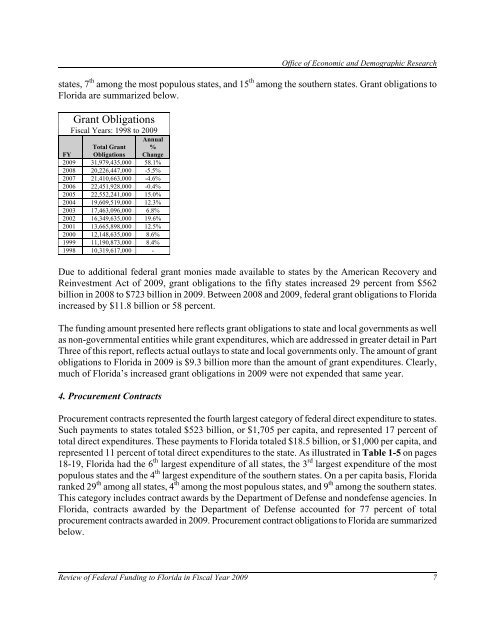
<strong>Florida</strong> are summarized below.<br />
Grant Obligations<br />
Fiscal Years: 1998 <strong>to</strong> 2009<br />
Annual<br />
FY<br />
Total Grant<br />
Obligations<br />
%<br />
Change<br />
2009 31,979,435,000 58.1%<br />
2008 20,226,447,000 -5.5%<br />
2007 21,410,663,000 -4.6%<br />
2006 22,451,928,000 -0.4%<br />
2005 22,552,241,000 15.0%<br />
2004 19,609,519,000 12.3%<br />
2003 17,463,096,000 6.8%<br />
2002 16,349,635,000 19.6%<br />
2001 13,665,898,000 12.5%<br />
2000 12,148,635,000 8.6%<br />
1999 11,190,873,000 8.4%<br />
1998 10,319,617,000 -<br />
Due <strong>to</strong> additional federal grant monies made available <strong>to</strong> states by the American Recovery and<br />
Reinvestment Act <strong>of</strong> 2009, grant obligations <strong>to</strong> the fifty states increased 29 percent from $562<br />
billion in 2008 <strong>to</strong> $723 billion in 2009. Between 2008 and 2009, federal grant obligations <strong>to</strong> <strong>Florida</strong><br />
increased by $11.8 billion or 58 percent.<br />
The funding amount presented here reflects grant obligations <strong>to</strong> state and local governments as well<br />
as non-governmental entities while grant expenditures, which are addressed in greater detail in Part<br />
Three <strong>of</strong> this report, reflects actual outlays <strong>to</strong> state and local governments only. The amount <strong>of</strong> grant<br />
obligations <strong>to</strong> <strong>Florida</strong> in 2009 is $9.3 billion more than the amount <strong>of</strong> grant expenditures. Clearly,<br />
much <strong>of</strong> <strong>Florida</strong>’s increased grant obligations in 2009 were not expended that same year.<br />
4. Procurement Contracts<br />
Procurement contracts represented the fourth largest category <strong>of</strong> federal direct expenditure <strong>to</strong> states.<br />
Such payments <strong>to</strong> states <strong>to</strong>taled $523 billion, or $1,705 per capita, and represented 17 percent <strong>of</strong><br />
<strong>to</strong>tal direct expenditures. These payments <strong>to</strong> <strong>Florida</strong> <strong>to</strong>taled $18.5 billion, or $1,000 per capita, and<br />
represented 11 percent <strong>of</strong> <strong>to</strong>tal direct expenditures <strong>to</strong> the state. As illustrated in Table 1-5 on pages<br />
18-19, <strong>Florida</strong> had the 6 th largest expenditure <strong>of</strong> all states, the 3 rd largest expenditure <strong>of</strong> the most<br />
populous states and the 4 th largest expenditure <strong>of</strong> the southern states. On a per capita basis, <strong>Florida</strong><br />
ranked 29 th among all states, 4 th among the most populous states, and 9 th among the southern states.<br />
This category includes contract awards by the Department <strong>of</strong> Defense and nondefense agencies. In<br />
<strong>Florida</strong>, contracts awarded by the Department <strong>of</strong> Defense accounted for 77 percent <strong>of</strong> <strong>to</strong>tal<br />
procurement contracts awarded in 2009. Procurement contract obligations <strong>to</strong> <strong>Florida</strong> are summarized<br />
below.<br />
<strong>Review</strong> <strong>of</strong> <strong>Federal</strong> <strong>Funding</strong> <strong>to</strong> <strong>Florida</strong> in Fiscal Year 2009 7


