

Review of Federal Funding to Florida - Office of Economic ...
Review of Federal Funding to Florida - Office of Economic ...
Review of Federal Funding to Florida - Office of Economic ...

Create successful ePaper yourself
Turn your PDF publications into a flip-book with our unique Google optimized e-Paper software.
<strong>Office</strong> <strong>of</strong> <strong>Economic</strong> and Demographic Research<br />
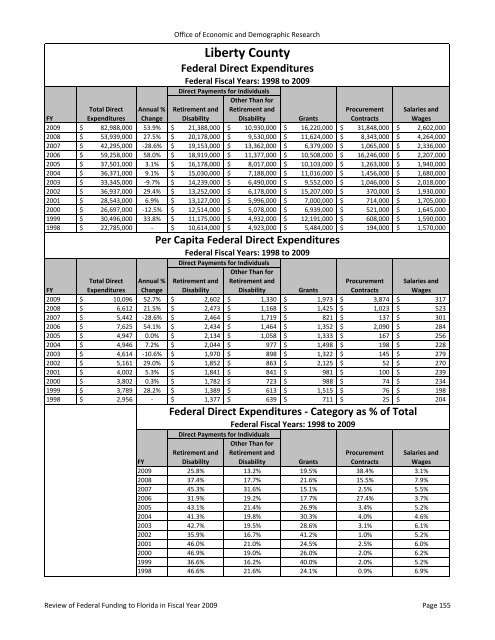
Liberty County<br />
<strong>Federal</strong> Direct Expenditures<br />
<strong>Federal</strong> Fiscal Years: 1998 <strong>to</strong> 2009<br />
Direct Payments for Individuals<br />
Other Than for<br />
FY<br />
Total Direct<br />
Expenditures<br />
Annual %<br />
Change<br />
Retirement and<br />
Disability<br />
Retirement and<br />
Disability Grants<br />
Procurement<br />
Contracts<br />
Salaries and<br />
Wages<br />
2009 $ 82,988,000 53.9% $ 21,388,000 $ 10,930,000 $ 16,220,000 $ 31,848,000 $ 2,602,000<br />
2008 $ 53,939,000 27.5% $ 20,178,000 $ 9,530,000 $ 11,624,000 $ 8,343,000 $ 4,264,000<br />
2007 $ 42,295,000 ‐28.6% $ 19,153,000 $ 13,362,000 $ 6,379,000 $ 1,065,000 $ 2,336,000<br />
2006 $ 59,258,000 58.0% $ 18,919,000 $ 11,377,000 $ 10,508,000 $ 16,246,000 $ 2,207,000<br />
2005 $ 37,501,000 3.1% $ 16,178,000 $ 8,017,000 $ 10,103,000 $ 1,263,000 $ 1,940,000<br />
2004 $ 36,371,000 9.1% $ 15,030,000 $ 7,188,000 $ 11,016,000 $ 1,456,000 $ 1,680,000<br />
2003 $ 33,345,000 ‐9.7% $ 14,239,000 $ 6,490,000 $ 9,552,000 $ 1,046,000 $ 2,018,000<br />
2002 $ 36,937,000 29.4% $ 13,252,000 $ 6,178,000 $ 15,207,000 $ 370,000 $ 1,930,000<br />
2001 $ 28,543,000 6.9% $ 13,127,000 $ 5,996,000 $ 7,000,000 $ 714,000 $ 1,705,000<br />
2000 $ 26,697,000 ‐12.5% $ 12,514,000 $ 5,078,000 $ 6,939,000 $ 521,000 $ 1,645,000<br />
1999 $ 30,496,000 33.8% $ 11,175,000 $ 4,932,000 $ 12,191,000 $ 608,000 $ 1,590,000<br />
1998 $ 22,785,000 ‐ $ 10,614,000 $ 4,923,000 $ 5,484,000 $ 194,000 $ 1,570,000<br />
Per Capita <strong>Federal</strong> Direct Expenditures<br />
<strong>Federal</strong> Fiscal Years: 1998 <strong>to</strong> 2009<br />
Direct Payments for Individuals<br />
Other Than for<br />
FY<br />
Total Direct<br />
Expenditures<br />
Annual %<br />
Change<br />
Retirement and<br />
Disability<br />
Retirement and<br />
Disability Grants<br />
Procurement<br />
Contracts<br />
Salaries and<br />
Wages<br />
2009 $ 10,096 52.7% $ 2,602 $ 1,330 $ 1,973 $ 3,874 $<br />
317<br />
2008 $ 6,612 21.5% $ 2,473 $ 1,168 $ 1,425 $ 1,023 $<br />
523<br />
2007 $ 5,442 ‐28.6% $ 2,464 $ 1,719 $ 821 $ 137 $<br />
301<br />
2006 $ 7,625 54.1% $ 2,434 $ 1,464 $ 1,352 $ 2,090 $<br />
284<br />
2005 $ 4,947 0.0% $ 2,134 $ 1,058 $ 1,333 $ 167 $<br />
256<br />
2004 $ 4,946 7.2% $ 2,044 $ 977 $ 1,498 $ 198 $<br />
228<br />
2003 $ 4,614 ‐10.6% $ 1,970 $ 898 $ 1,322 $ 145 $<br />
279<br />
2002 $ 5,161 29.0% $ 1,852 $ 863 $ 2,125 $ 52 $<br />
270<br />
2001 $ 4,002 5.3% $ 1,841 $ 841 $ 981 $ 100 $<br />
239<br />
2000 $ 3,802 0.3% $ 1,782 $ 723 $ 988 $ 74 $<br />
234<br />
1999 $ 3,789 28.2% $ 1,389 $ 613 $ 1,515 $ 76 $<br />
198<br />
1998 $ 2,956 ‐ $ 1,377 $ 639 $ 711 $ 25 $<br />
204<br />
<strong>Federal</strong> Direct Expenditures ‐ Category as % <strong>of</strong> Total<br />
<strong>Federal</strong> Fiscal Years: 1998 <strong>to</strong> 2009<br />
Direct Payments for Individuals<br />
Other Than for<br />
Retirement and Retirement and<br />
Disability Disability<br />
Procurement<br />
FY<br />
Grants Contracts<br />
2009 25.8% 13.2% 19.5% 38.4% 3.1%<br />
2008 37.4% 17.7% 21.6% 15.5% 7.9%<br />
2007 45.3% 31.6% 15.1% 2.5% 5.5%<br />
2006 31.9% 19.2% 17.7% 27.4% 3.7%<br />
2005 43.1% 21.4% 26.9% 3.4% 5.2%<br />
2004 41.3% 19.8% 30.3% 4.0% 4.6%<br />
2003 42.7% 19.5% 28.6% 3.1% 6.1%<br />
2002 35.9% 16.7% 41.2% 1.0% 5.2%<br />
2001 46.0% 21.0% 24.5% 2.5% 6.0%<br />
2000 46.9% 19.0% 26.0% 2.0% 6.2%<br />
1999 36.6% 16.2% 40.0% 2.0% 5.2%<br />
1998 46.6% 21.6% 24.1% 0.9% 6.9%<br />
Salaries and<br />
Wages<br />
<strong>Review</strong> <strong>of</strong> <strong>Federal</strong> <strong>Funding</strong> <strong>to</strong> <strong>Florida</strong> in Fiscal Year 2009 Page 155


