

Review of Federal Funding to Florida - Office of Economic ...
Review of Federal Funding to Florida - Office of Economic ...
Review of Federal Funding to Florida - Office of Economic ...

Create successful ePaper yourself
Turn your PDF publications into a flip-book with our unique Google optimized e-Paper software.
<strong>Office</strong> <strong>of</strong> <strong>Economic</strong> and Demographic Research<br />
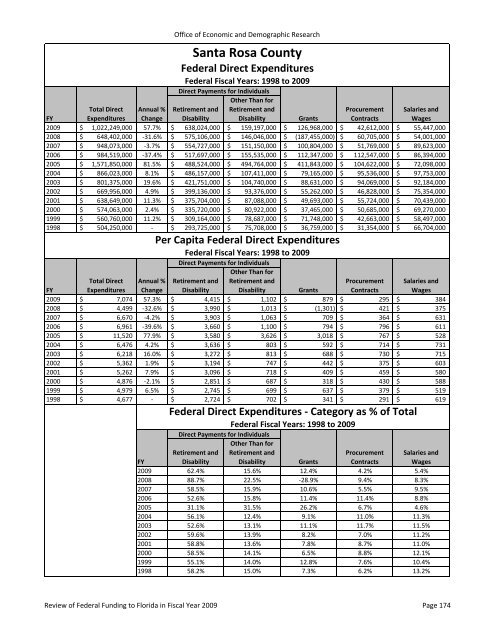
Santa Rosa County<br />
<strong>Federal</strong> Direct Expenditures<br />
<strong>Federal</strong> Fiscal Years: 1998 <strong>to</strong> 2009<br />
Direct Payments for Individuals<br />
Other Than for<br />
FY<br />
Total Direct<br />
Expenditures<br />
Annual %<br />
Change<br />
Retirement and<br />
Disability<br />
Retirement and<br />
Disability Grants<br />
Procurement<br />
Contracts<br />
Salaries and<br />
Wages<br />
2009 $ 1,022,249,000 57.7% $ 638,024,000 $ 159,197,000 $ 126,968,000 $ 42,612,000 $ 55,447,000<br />
2008 $ 648,402,000 ‐31.6% $ 575,106,000 $ 146,046,000 $ (187,455,000) $ 60,705,000 $ 54,001,000<br />
2007 $ 948,073,000 ‐3.7% $ 554,727,000 $ 151,150,000 $ 100,804,000 $ 51,769,000 $ 89,623,000<br />
2006 $ 984,519,000 ‐37.4% $ 517,697,000 $ 155,535,000 $ 112,347,000 $ 112,547,000 $ 86,394,000<br />
2005 $ 1,571,850,000 81.5% $ 488,524,000 $ 494,764,000 $ 411,843,000 $ 104,622,000 $ 72,098,000<br />
2004 $ 866,023,000 8.1% $ 486,157,000 $ 107,411,000 $ 79,165,000 $ 95,536,000 $ 97,753,000<br />
2003 $ 801,375,000 19.6% $ 421,751,000 $ 104,740,000 $ 88,631,000 $ 94,069,000 $ 92,184,000<br />
2002 $ 669,956,000 4.9% $ 399,136,000 $ 93,376,000 $ 55,262,000 $ 46,828,000 $ 75,354,000<br />
2001 $ 638,649,000 11.3% $ 375,704,000 $ 87,088,000 $ 49,693,000 $ 55,724,000 $ 70,439,000<br />
2000 $ 574,063,000 2.4% $ 335,720,000 $ 80,922,000 $ 37,465,000 $ 50,685,000 $ 69,270,000<br />
1999 $ 560,760,000 11.2% $ 309,164,000 $ 78,687,000 $ 71,748,000 $ 42,663,000 $ 58,497,000<br />
1998 $ 504,250,000 ‐ $ 293,725,000 $ 75,708,000 $ 36,759,000 $ 31,354,000 $ 66,704,000<br />
Per Capita <strong>Federal</strong> Direct Expenditures<br />
<strong>Federal</strong> Fiscal Years: 1998 <strong>to</strong> 2009<br />
Direct Payments for Individuals<br />
Other Than for<br />
FY<br />
Total Direct<br />
Expenditures<br />
Annual %<br />
Change<br />
Retirement and<br />
Disability<br />
Retirement and<br />
Disability Grants<br />
Procurement<br />
Contracts<br />
Salaries and<br />
Wages<br />
2009 $ 7,074 57.3% $ 4,415 $ 1,102 $ 879 $ 295 $<br />
384<br />
2008 $ 4,499 ‐32.6% $ 3,990 $ 1,013 $ (1,301) $ 421 $<br />
375<br />
2007 $ 6,670 ‐4.2% $ 3,903 $ 1,063 $ 709 $ 364 $<br />
631<br />
2006 $ 6,961 ‐39.6% $ 3,660 $ 1,100 $ 794 $ 796 $<br />
611<br />
2005 $ 11,520 77.9% $ 3,580 $ 3,626 $ 3,018 $ 767 $<br />
528<br />
2004 $ 6,476 4.2% $ 3,636 $ 803 $ 592 $ 714 $<br />
731<br />
2003 $ 6,218 16.0% $ 3,272 $ 813 $ 688 $ 730 $<br />
715<br />
2002 $ 5,362 1.9% $ 3,194 $ 747 $ 442 $ 375 $<br />
603<br />
2001 $ 5,262 7.9% $ 3,096 $ 718 $ 409 $ 459 $<br />
580<br />
2000 $ 4,876 ‐2.1% $ 2,851 $ 687 $ 318 $ 430 $<br />
588<br />
1999 $ 4,979 6.5% $ 2,745 $ 699 $ 637 $ 379 $<br />
519<br />
1998 $ 4,677 ‐ $ 2,724 $ 702 $ 341 $ 291 $<br />
619<br />
<strong>Federal</strong> Direct Expenditures ‐ Category as % <strong>of</strong> Total<br />
<strong>Federal</strong> Fiscal Years: 1998 <strong>to</strong> 2009<br />
Direct Payments for Individuals<br />
Other Than for<br />
FY<br />
Retirement and<br />
Disability<br />
Retirement and<br />
Disability Grants<br />
Procurement<br />
Contracts<br />
Salaries and<br />
Wages<br />
2009 62.4% 15.6% 12.4% 4.2% 5.4%<br />
2008 88.7% 22.5% ‐28.9% 9.4% 8.3%<br />
2007 58.5% 15.9% 10.6% 5.5% 9.5%<br />
2006 52.6% 15.8% 11.4% 11.4% 8.8%<br />
2005 31.1% 31.5% 26.2% 6.7% 4.6%<br />
2004 56.1% 12.4% 9.1% 11.0% 11.3%<br />
2003 52.6% 13.1% 11.1% 11.7% 11.5%<br />
2002 59.6% 13.9% 8.2% 7.0% 11.2%<br />
2001 58.8% 13.6% 7.8% 8.7% 11.0%<br />
2000 58.5% 14.1% 6.5% 8.8% 12.1%<br />
1999 55.1% 14.0% 12.8% 7.6% 10.4%<br />
1998 58.2% 15.0% 7.3% 6.2% 13.2%<br />
<strong>Review</strong> <strong>of</strong> <strong>Federal</strong> <strong>Funding</strong> <strong>to</strong> <strong>Florida</strong> in Fiscal Year 2009 Page 174


