

Review of Federal Funding to Florida - Office of Economic ...
Review of Federal Funding to Florida - Office of Economic ...
Review of Federal Funding to Florida - Office of Economic ...

You also want an ePaper? Increase the reach of your titles
YUMPU automatically turns print PDFs into web optimized ePapers that Google loves.
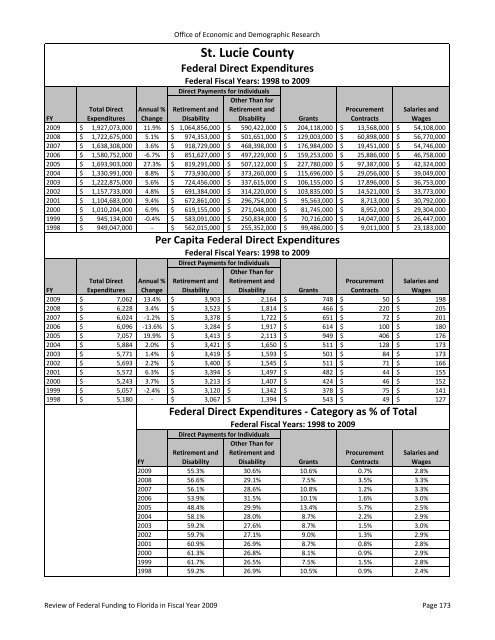
<strong>Office</strong> <strong>of</strong> <strong>Economic</strong> and Demographic Research<br />
St. Lucie County<br />
<strong>Federal</strong> Direct Expenditures<br />
<strong>Federal</strong> Fiscal Years: 1998 <strong>to</strong> 2009<br />
Direct Payments for Individuals<br />
Other Than for<br />
FY<br />
Total Direct<br />
Expenditures<br />
Annual %<br />
Change<br />
Retirement and<br />
Disability<br />
Retirement and<br />
Disability Grants<br />
Procurement<br />
Contracts<br />
Salaries and<br />
Wages<br />
2009 $ 1,927,073,000 11.9% $ 1,064,856,000 $ 590,422,000 $ 204,118,000 $ 13,568,000 $ 54,108,000<br />
2008 $ 1,722,675,000 5.1% $ 974,353,000 $ 501,651,000 $ 129,003,000 $ 60,898,000 $ 56,770,000<br />
2007 $ 1,638,308,000 3.6% $ 918,729,000 $ 468,398,000 $ 176,984,000 $ 19,451,000 $ 54,746,000<br />
2006 $ 1,580,752,000 ‐6.7% $ 851,627,000 $ 497,229,000 $ 159,253,000 $ 25,886,000 $ 46,758,000<br />
2005 $ 1,693,903,000 27.3% $ 819,291,000 $ 507,122,000 $ 227,780,000 $ 97,387,000 $ 42,324,000<br />
2004 $ 1,330,991,000 8.8% $ 773,930,000 $ 373,260,000 $ 115,696,000 $ 29,056,000 $ 39,049,000<br />
2003 $ 1,222,875,000 5.6% $ 724,456,000 $ 337,615,000 $ 106,155,000 $ 17,896,000 $ 36,753,000<br />
2002 $ 1,157,733,000 4.8% $ 691,384,000 $ 314,220,000 $ 103,835,000 $ 14,521,000 $ 33,773,000<br />
2001 $ 1,104,683,000 9.4% $ 672,861,000 $ 296,754,000 $ 95,563,000 $ 8,713,000 $ 30,792,000<br />
2000 $ 1,010,204,000 6.9% $ 619,155,000 $ 271,048,000 $ 81,745,000 $ 8,952,000 $ 29,304,000<br />
1999 $ 945,134,000 ‐0.4% $ 583,091,000 $ 250,834,000 $ 70,716,000 $ 14,047,000 $ 26,447,000<br />
1998 $ 949,047,000 ‐ $ 562,015,000 $ 255,352,000 $ 99,486,000 $ 9,011,000 $ 23,183,000<br />
Per Capita <strong>Federal</strong> Direct Expenditures<br />
<strong>Federal</strong> Fiscal Years: 1998 <strong>to</strong> 2009<br />
Direct Payments for Individuals<br />
Other Than for<br />
FY<br />
Total Direct<br />
Expenditures<br />
Annual %<br />
Change<br />
Retirement and<br />
Disability<br />
Retirement and<br />
Disability Grants<br />
Procurement<br />
Contracts<br />
Salaries and<br />
Wages<br />
2009 $ 7,062 13.4% $ 3,903 $ 2,164 $ 748 $ 50 $<br />
198<br />
2008 $ 6,228 3.4% $ 3,523 $ 1,814 $ 466 $ 220 $<br />
205<br />
2007 $ 6,024 ‐1.2% $ 3,378 $ 1,722 $ 651 $ 72 $<br />
201<br />
2006 $ 6,096 ‐13.6% $ 3,284 $ 1,917 $ 614 $ 100 $<br />
180<br />
2005 $ 7,057 19.9% $ 3,413 $ 2,113 $ 949 $ 406 $<br />
176<br />
2004 $ 5,884 2.0% $ 3,421 $ 1,650 $ 511 $ 128 $<br />
173<br />
2003 $ 5,771 1.4% $ 3,419 $ 1,593 $ 501 $ 84 $<br />
173<br />
2002 $ 5,693 2.2% $ 3,400 $ 1,545 $ 511 $ 71 $<br />
166<br />
2001 $ 5,572 6.3% $ 3,394 $ 1,497 $ 482 $ 44 $<br />
155<br />
2000 $ 5,243 3.7% $ 3,213 $ 1,407 $ 424 $ 46 $<br />
152<br />
1999 $ 5,057 ‐2.4% $ 3,120 $ 1,342 $ 378 $ 75 $<br />
141<br />
1998 $ 5,180 ‐ $ 3,067 $ 1,394 $ 543 $ 49 $<br />
127<br />
<strong>Federal</strong> Direct Expenditures ‐ Category as % <strong>of</strong> Total<br />
<strong>Federal</strong> Fiscal Years: 1998 <strong>to</strong> 2009<br />
Direct Payments for Individuals<br />
Other Than for<br />
Retirement and Retirement and<br />
Disability Disability<br />
Procurement<br />
FY<br />
Grants Contracts<br />
2009 55.3% 30.6% 10.6% 0.7% 2.8%<br />
2008 56.6% 29.1% 7.5% 3.5% 3.3%<br />
2007 56.1% 28.6% 10.8% 1.2% 3.3%<br />
2006 53.9% 31.5% 10.1% 1.6% 3.0%<br />
2005 48.4% 29.9% 13.4% 5.7% 2.5%<br />
2004 58.1% 28.0% 8.7% 2.2% 2.9%<br />
2003 59.2% 27.6% 8.7% 1.5% 3.0%<br />
2002 59.7% 27.1% 9.0% 1.3% 2.9%<br />
2001 60.9% 26.9% 8.7% 0.8% 2.8%<br />
2000 61.3% 26.8% 8.1% 0.9% 2.9%<br />
1999 61.7% 26.5% 7.5% 1.5% 2.8%<br />
1998 59.2% 26.9% 10.5% 0.9% 2.4%<br />
Salaries and<br />
Wages<br />
<strong>Review</strong> <strong>of</strong> <strong>Federal</strong> <strong>Funding</strong> <strong>to</strong> <strong>Florida</strong> in Fiscal Year 2009 Page 173


