Concessions and Leases in the Lao PDR
Concessions and Leases in the Lao PDR
Concessions and Leases in the Lao PDR

Create successful ePaper yourself
Turn your PDF publications into a flip-book with our unique Google optimized e-Paper software.
area data <strong>and</strong> cover 1.1 million hectares (see Figure 1).<br />
It also <strong>in</strong>cludes one section on m<strong>in</strong><strong>in</strong>g exploration projects,<br />
which total roughly an additional million hectares. For<br />
<strong>the</strong> m<strong>in</strong><strong>in</strong>g exploration subsector, <strong>the</strong> <strong>in</strong>ventory data was<br />
checked <strong>and</strong> completed with <strong>the</strong> latest available data provided<br />
by <strong>the</strong> M<strong>in</strong>istry of Energy <strong>and</strong> M<strong>in</strong>es (MEM 2010).<br />
For <strong>the</strong> spatial analysis of <strong>the</strong> context of exist<strong>in</strong>g l<strong>and</strong> deals <strong>in</strong><br />
<strong>the</strong> <strong>Lao</strong> <strong>PDR</strong> (presented <strong>in</strong> chapter 3), only <strong>the</strong> deals for which<br />
geographic location was encoded <strong>in</strong> <strong>the</strong> <strong>in</strong>ventory could be<br />
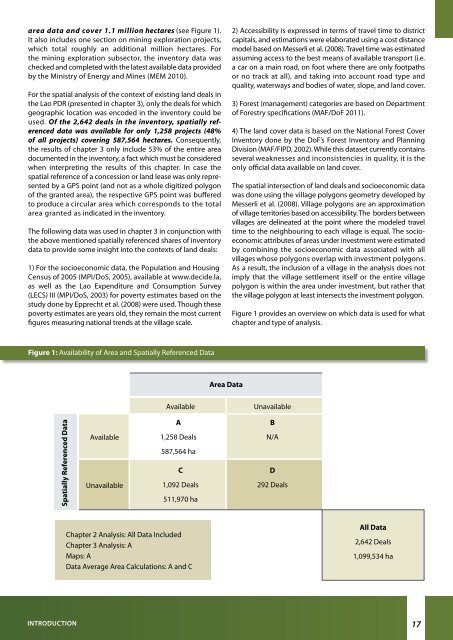
used. Of <strong>the</strong> 2,642 deals <strong>in</strong> <strong>the</strong> <strong>in</strong>ventory, spatially referenced<br />
data was available for only 1,258 projects (48%<br />
of all projects) cover<strong>in</strong>g 587,564 hectares. Consequently,<br />
<strong>the</strong> results of chapter 3 only <strong>in</strong>clude 53% of <strong>the</strong> entire area<br />
documented <strong>in</strong> <strong>the</strong> <strong>in</strong>ventory, a fact which must be considered<br />
when <strong>in</strong>terpret<strong>in</strong>g <strong>the</strong> results of this chapter. In case <strong>the</strong><br />
spatial reference of a concession or l<strong>and</strong> lease was only represented<br />
by a GPS po<strong>in</strong>t (<strong>and</strong> not as a whole digitized polygon<br />
of <strong>the</strong> granted area), <strong>the</strong> respective GPS po<strong>in</strong>t was buffered<br />
to produce a circular area which corresponds to <strong>the</strong> total<br />
area granted as <strong>in</strong>dicated <strong>in</strong> <strong>the</strong> <strong>in</strong>ventory.<br />
The follow<strong>in</strong>g data was used <strong>in</strong> chapter 3 <strong>in</strong> conjunction with<br />
<strong>the</strong> above mentioned spatially referenced shares of <strong>in</strong>ventory<br />
data to provide some <strong>in</strong>sight <strong>in</strong>to <strong>the</strong> contexts of l<strong>and</strong> deals:<br />
1) For <strong>the</strong> socioeconomic data, <strong>the</strong> Population <strong>and</strong> Hous<strong>in</strong>g<br />
Census of 2005 (MPI/DoS, 2005), available at www.decide.la,<br />
as well as <strong>the</strong> <strong>Lao</strong> Expenditure <strong>and</strong> Consumption Survey<br />
(LECS) III (MPI/DoS, 2003) for poverty estimates based on <strong>the</strong><br />
study done by Epprecht et al. (2008) were used. Though <strong>the</strong>se<br />
poverty estimates are years old, <strong>the</strong>y rema<strong>in</strong> <strong>the</strong> most current<br />
figures measur<strong>in</strong>g national trends at <strong>the</strong> village scale.<br />
2) Accessibility is expressed <strong>in</strong> terms of travel time to district<br />
capitals, <strong>and</strong> estimations were elaborated us<strong>in</strong>g a cost distance<br />
model based on Messerli et al. (2008). Travel time was estimated<br />
assum<strong>in</strong>g access to <strong>the</strong> best means of available transport (i.e.<br />
a car on a ma<strong>in</strong> road, on foot where <strong>the</strong>re are only footpaths<br />
or no track at all), <strong>and</strong> tak<strong>in</strong>g <strong>in</strong>to account road type <strong>and</strong><br />
quality, waterways <strong>and</strong> bodies of water, slope, <strong>and</strong> l<strong>and</strong> cover.<br />
3) Forest (management) categories are based on Department<br />
of Forestry specifications (MAF/DoF 2011).<br />
4) The l<strong>and</strong> cover data is based on <strong>the</strong> National Forest Cover<br />
Inventory done by <strong>the</strong> DoF’s Forest Inventory <strong>and</strong> Plann<strong>in</strong>g<br />
Division (MAF/FIPD, 2002). While this dataset currently conta<strong>in</strong>s<br />
several weaknesses <strong>and</strong> <strong>in</strong>consistencies <strong>in</strong> quality, it is <strong>the</strong><br />
only official data available on l<strong>and</strong> cover.<br />
The spatial <strong>in</strong>tersection of l<strong>and</strong> deals <strong>and</strong> socioeconomic data<br />
was done us<strong>in</strong>g <strong>the</strong> village polygons geometry developed by<br />
Messerli et al. (2008). Village polygons are an approximation<br />
of village territories based on accessibility. The borders between<br />
villages are del<strong>in</strong>eated at <strong>the</strong> po<strong>in</strong>t where <strong>the</strong> modeled travel<br />
time to <strong>the</strong> neighbour<strong>in</strong>g to each village is equal. The socioeconomic<br />
attributes of areas under <strong>in</strong>vestment were estimated<br />
by comb<strong>in</strong><strong>in</strong>g <strong>the</strong> socioeconomic data associated with all<br />
villages whose polygons overlap with <strong>in</strong>vestment polygons.<br />
As a result, <strong>the</strong> <strong>in</strong>clusion of a village <strong>in</strong> <strong>the</strong> analysis does not<br />
imply that <strong>the</strong> village settlement itself or <strong>the</strong> entire village<br />
polygon is with<strong>in</strong> <strong>the</strong> area under <strong>in</strong>vestment, but ra<strong>the</strong>r that<br />
<strong>the</strong> village polygon at least <strong>in</strong>tersects <strong>the</strong> <strong>in</strong>vestment polygon.<br />
Figure 1 provides an overview on which data is used for what<br />
chapter <strong>and</strong> type of analysis.<br />
Figure 1: Availability of Area <strong>and</strong> Spatially Referenced Data<br />
Area Data<br />
Available<br />
Unavailable<br />
Spatially Referenced Data<br />
Available<br />
Unavailable<br />
A<br />
1,258 Deals<br />
587,564 ha<br />
C<br />
1,092 Deals<br />
511,970 ha<br />
B<br />
N/A<br />
D<br />
292 Deals<br />
Chapter 2 Analysis: All Data Included<br />
Chapter 3 Analysis: A<br />
Maps: A<br />
Data Average Area Calculations: A <strong>and</strong> C<br />
All Data<br />
2,642 Deals<br />
1,099,534 ha<br />
INTRODUCTION<br />
17