Concessions and Leases in the Lao PDR
Concessions and Leases in the Lao PDR
Concessions and Leases in the Lao PDR

Create successful ePaper yourself
Turn your PDF publications into a flip-book with our unique Google optimized e-Paper software.
Table 22: Poverty Incidence by Subsector <strong>and</strong> Investor Type<br />
Subsector<br />
Foreign<br />
Investors<br />
Poverty Incidence<br />
Domestic<br />
Investors<br />
Jo<strong>in</strong>t Ventures<br />
All Areas<br />
under<br />
Investment<br />
Agriculture<br />
32%<br />
21%<br />
22%<br />
29%<br />
Communications<br />
n/a<br />
40%<br />
19%<br />
35%<br />
Construction<br />
31%<br />
16%<br />
10%<br />
17%<br />
Education<br />
n/a<br />
18%<br />
n/a<br />
18%<br />
Electricity<br />
n/a<br />
13%<br />
34%<br />
16%<br />
Forestry<br />
39%<br />
29%<br />
40%<br />
37%<br />
Manufactur<strong>in</strong>g/Process<strong>in</strong>g<br />
26%<br />
22%<br />
22%<br />
23%<br />
M<strong>in</strong><strong>in</strong>g<br />
36%<br />
26%<br />
36%<br />
30%<br />
Services/Utilities<br />
11%<br />
15%<br />
11%<br />
15%<br />
Tourism<br />
21%<br />
21%<br />
18%<br />
20%<br />
Transport<br />
n/a<br />
26%<br />
n/a<br />
26%<br />
Wholesale/Trade<br />
22%<br />
26%<br />
19%<br />
25%<br />
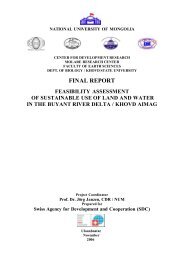
Figure 20: Poverty Incidence <strong>in</strong> Areas under Investment <strong>and</strong> % of Villages with Poverty Incidence Higher (Poorer) than <strong>the</strong><br />
National Average by Investor Country of Orig<strong>in</strong><br />
100%<br />
90%<br />
80%<br />
% of Villages<br />
70%<br />
60%<br />
50%<br />
40%<br />
30%<br />
20%<br />
10%<br />
0%<br />
India<br />
Vietnam<br />
Ch<strong>in</strong>a<br />
Jo<strong>in</strong>t Venture<br />
Thail<strong>and</strong><br />
South Korea<br />
<strong>Lao</strong> <strong>PDR</strong><br />
Japan<br />
Poverty Incidence<br />
Villages with Poverty Incidence Higher (Poorer) than National Average<br />
CONTEXT OF INVESTMENT<br />
63