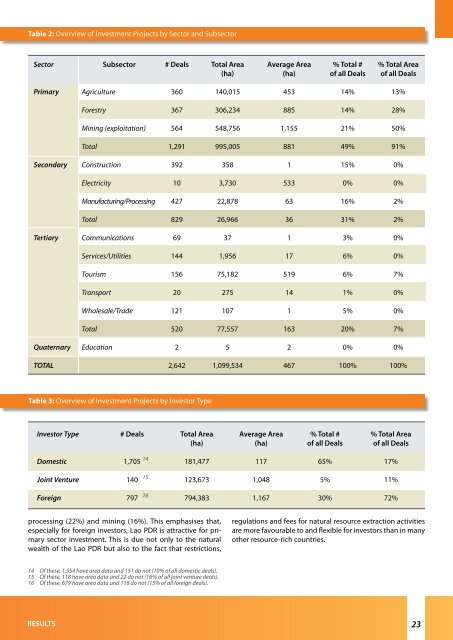
2.1.2 - Sectors <strong>and</strong> Subsectors This analysis reveals significant dist<strong>in</strong>ctions <strong>in</strong> <strong>the</strong> characteristics of <strong>in</strong>vestment projects across economic sectors 13. Not surpris<strong>in</strong>g consider<strong>in</strong>g that <strong>the</strong> <strong>Lao</strong> <strong>PDR</strong> economy is largely natural resource based, <strong>the</strong> primary sector is <strong>the</strong> largest <strong>in</strong> terms of l<strong>and</strong> deals <strong>and</strong> claims 91% of <strong>the</strong> total area of l<strong>and</strong> under <strong>in</strong>vestment. In terms of number of deals, however, <strong>the</strong> secondary <strong>and</strong> tertiary sectors still make up slightly over half of all projects, though <strong>the</strong>y are much smaller <strong>in</strong> average size (36 <strong>and</strong> 163 ha respectively) compared to <strong>the</strong> average size of l<strong>and</strong> deals with<strong>in</strong> <strong>the</strong> primary sector (881 ha) (see Table 2). M<strong>in</strong><strong>in</strong>g deals represent 21% of all <strong>in</strong>vestment projects but an astonish<strong>in</strong>g 50% of <strong>the</strong> total area under <strong>in</strong>vestment, mak<strong>in</strong>g it <strong>the</strong> largest subsector. Construction follows with <strong>the</strong> second most <strong>in</strong>vestment projects, but most are small <strong>in</strong> area <strong>and</strong> altoge<strong>the</strong>r do not even comprise 1% of <strong>the</strong> total area under <strong>in</strong>vestment. Agriculture <strong>and</strong> forestry each represent approximately 14% of all <strong>in</strong>vestment projects <strong>and</strong> cover areas 13% <strong>and</strong> 28% of <strong>the</strong> total area under <strong>in</strong>vestment respectively. While forestry typically encompasses a range of activities, <strong>in</strong> <strong>the</strong> context of this analysis, activities <strong>in</strong> <strong>the</strong> forestry subsector refer to tree plantation concessions <strong>and</strong> leases, but do not <strong>in</strong>clude logg<strong>in</strong>g concessions. In addition, l<strong>and</strong> deals <strong>in</strong> forestry suffer a problematic association with reforestation activities, which often results <strong>in</strong> <strong>the</strong> mis<strong>in</strong>terpretation of tree plantations as reforestation activities, which is not <strong>the</strong> <strong>in</strong>tent of <strong>the</strong> authors. Meanwhile, <strong>the</strong> less l<strong>and</strong>-<strong>in</strong>tensive construction, communications, transport, wholesale/trade <strong>and</strong> education subsectors represent a total of 604 deals (23%), but cover a negligible area. In terms of average size of l<strong>and</strong> deals, <strong>the</strong> picture is fairly straightforward: primary sector deals seek larger areas of l<strong>and</strong> for <strong>the</strong>ir l<strong>and</strong>-<strong>in</strong>tensive activities, as this allows <strong>the</strong>m to take advantage of economies of scale <strong>and</strong> maximize profits, whereas <strong>the</strong> secondary <strong>and</strong> tertiary sectors, with a few exceptions, seek only enough l<strong>and</strong> for <strong>in</strong>frastructure-related construction <strong>and</strong> <strong>the</strong>refore are small <strong>in</strong> comparison. The average area of m<strong>in</strong><strong>in</strong>g deals (1,155 ha) is by far <strong>the</strong> largest, <strong>and</strong> is more than twice <strong>the</strong> average size of <strong>in</strong>vestment projects overall (467 ha). Forestry deals are <strong>the</strong> second largest with an average of 885 ha, <strong>and</strong> agriculture deals are 453 ha on average. F<strong>in</strong>ally, tourism amounts to a small but significant portion of all area granted for <strong>in</strong>vestment (5% of total), largely due to one major eco-tourism project <strong>in</strong> Bokeo <strong>and</strong> a number of golf courses, each cover<strong>in</strong>g sizeable amounts of l<strong>and</strong>. This may po<strong>in</strong>t to <strong>the</strong> grow<strong>in</strong>g importance of tourism to <strong>the</strong> <strong>Lao</strong> economy, as it is <strong>the</strong> only subsector outside of <strong>the</strong> primary sector claim<strong>in</strong>g over 5% of all area granted. The share of l<strong>and</strong> deals <strong>and</strong> area under <strong>in</strong>vestment <strong>in</strong> <strong>the</strong> ma<strong>in</strong> subsectors (agriculture, forestry <strong>and</strong> m<strong>in</strong><strong>in</strong>g) also depicts to a certa<strong>in</strong> extent <strong>the</strong> state of economic development <strong>in</strong> <strong>the</strong> <strong>Lao</strong> <strong>PDR</strong>. Accord<strong>in</strong>g to <strong>the</strong> World Bank (2010), forestry, agriculture, hydropower <strong>and</strong> m<strong>in</strong>erals comprise more than half of <strong>the</strong> total wealth of <strong>the</strong> country; from 2005 to 2010, one third of GDP growth was from <strong>the</strong> hydropower <strong>and</strong> m<strong>in</strong><strong>in</strong>g subsectors alone. 2.1.4 - Orig<strong>in</strong> of Investment In compar<strong>in</strong>g <strong>the</strong> scale of domestic to foreign <strong>and</strong> jo<strong>in</strong>t venture (JV) l<strong>and</strong> deals, average area under <strong>in</strong>vestment per project varies drastically. A majority of <strong>in</strong>vestment projects are domestic <strong>in</strong>vestments (65%), but <strong>the</strong>se altoge<strong>the</strong>r comprise only 17% of <strong>the</strong> total area under <strong>in</strong>vestment. Foreign <strong>in</strong>vestment projects, or foreign direct <strong>in</strong>vestment (FDI), hold <strong>the</strong> greatest area of l<strong>and</strong> overall, constitut<strong>in</strong>g 72% of <strong>the</strong> total area under <strong>in</strong>vestment, but only 30% of projects. The average size of FDI projects is 1,167 ha, which is ten times <strong>the</strong> average size of domestic <strong>in</strong>vestment projects (117 ha) (see Table 3). This confirms general assumptions that, <strong>in</strong> terms of area granted, FDI projects tend to be significantly larger, <strong>and</strong> that FDI as a whole is <strong>the</strong> dom<strong>in</strong>ant form of l<strong>and</strong>-<strong>in</strong>tensive <strong>in</strong>vestment <strong>in</strong> <strong>the</strong> <strong>Lao</strong> <strong>PDR</strong>. Map 2 shows <strong>the</strong> <strong>in</strong>ventory data accord<strong>in</strong>g to <strong>in</strong>vestors’ country of orig<strong>in</strong>. With 140 <strong>in</strong>vestment projects, jo<strong>in</strong>t ventures amount to only 5% of all projects, but have a large average area of 1,048 ha, which is almost <strong>the</strong> same as that of FDI deals. This may <strong>in</strong>dicate that foreign <strong>in</strong>vestors, <strong>in</strong>clud<strong>in</strong>g those who have entered <strong>in</strong>to jo<strong>in</strong>t venture agreements, often have greater access to <strong>in</strong>vestment capital than <strong>Lao</strong> <strong>in</strong>vestors have. Reasons for this range from <strong>the</strong> less developed lend<strong>in</strong>g system <strong>in</strong> <strong>the</strong> <strong>Lao</strong> <strong>PDR</strong>, to <strong>the</strong> stronger f<strong>in</strong>ancial support foreign <strong>in</strong>vestors receive from <strong>the</strong>ir own governments <strong>and</strong> bank<strong>in</strong>g systems, <strong>and</strong> <strong>the</strong> existence of diplomatically facilitated capital-<strong>in</strong>tensive l<strong>and</strong> deals. Favourable <strong>in</strong>vestment regulations for certa<strong>in</strong> foreign firms are often established ad hoc, based on diplomatic negotiations <strong>in</strong>volv<strong>in</strong>g, for example, strategic aid to <strong>the</strong> GoL for <strong>in</strong>frastructure or key development projects. The difference <strong>in</strong> <strong>the</strong> average areas of FDI <strong>and</strong> JV projects as compared with domestic projects also parallels <strong>the</strong> distribution of primary sector projects across <strong>in</strong>vestor types. 67% of all FDI projects are <strong>in</strong> <strong>the</strong> primary sector, which is significantly more than <strong>the</strong> 40% of domestic projects <strong>and</strong> even <strong>the</strong> 51% of jo<strong>in</strong>t ventures. When compar<strong>in</strong>g <strong>the</strong> largest subsectors across <strong>in</strong>vestor types, most domestic deals are with<strong>in</strong> <strong>the</strong> m<strong>in</strong><strong>in</strong>g (24%) <strong>and</strong> construction subsectors (21%). Most JV deals are with<strong>in</strong> manufactur<strong>in</strong>g/process<strong>in</strong>g (26%), followed by agriculture (19%) <strong>and</strong> m<strong>in</strong><strong>in</strong>g (17%), while FDI deals are distributed quite evenly between forestry (27%), agriculture (24%), manufactur<strong>in</strong>g/ 13 Typically, four sectors of <strong>the</strong> economy are referred to: <strong>the</strong> primary sector <strong>in</strong>volves <strong>the</strong> extraction of raw materials <strong>and</strong> production of basic foods; <strong>the</strong> secondary sector manufactures f<strong>in</strong>ished goods; <strong>the</strong> tertiary sector <strong>in</strong>cludes all service <strong>in</strong>dustries; <strong>and</strong> <strong>the</strong> quaternary sector consists of <strong>in</strong>tellectual activities. As only two projects <strong>in</strong> <strong>the</strong> quaternary sector are <strong>in</strong>cluded <strong>in</strong> <strong>the</strong> <strong>in</strong>ventory, this sector is not fur<strong>the</strong>r analysed here. 22 <strong>Concessions</strong> <strong>and</strong> <strong>Leases</strong> <strong>in</strong> <strong>the</strong> <strong>Lao</strong> <strong>PDR</strong>: Tak<strong>in</strong>g Stock of L<strong>and</strong> Investments
Table 2: Overview of Investment Projects by Sector <strong>and</strong> Subsector Sector Subsector # Deals Total Area (ha) Average Area (ha) % Total # of all Deals % Total Area of all Deals Primary Agriculture 360 140,015 453 14% 13% Forestry 367 306,234 885 14% 28% M<strong>in</strong><strong>in</strong>g (exploitation) 564 548,756 1,155 21% 50% Total 1,291 995,005 881 49% 91% Secondary Construction 392 358 1 15% 0% Electricity 10 3,730 533 0% 0% Manufactur<strong>in</strong>g/Process<strong>in</strong>g 427 22,878 63 16% 2% Total 829 26,966 36 31% 2% Tertiary Communications 69 37 1 3% 0% Services/Utilities 144 1,956 17 6% 0% Tourism 156 75,182 519 6% 7% Transport 20 275 14 1% 0% Wholesale/Trade 121 107 1 5% 0% Total 520 77,557 163 20% 7% Quaternary Education 2 5 2 0% 0% TOTAL 2,642 1,099,534 467 100% 100% Table 3: Overview of Investment Projects by Investor Type Investor Type # Deals Total Area (ha) Average Area (ha) % Total # of all Deals % Total Area of all Deals Domestic 1,705 14 181,477 117 65% 17% Jo<strong>in</strong>t Venture 140 15 123,673 1,048 5% 11% Foreign 797 16 794,383 1,167 30% 72% process<strong>in</strong>g (22%) <strong>and</strong> m<strong>in</strong><strong>in</strong>g (16%). This emphasises that, especially for foreign <strong>in</strong>vestors, <strong>Lao</strong> <strong>PDR</strong> is attractive for primary sector <strong>in</strong>vestment. This is due not only to <strong>the</strong> natural wealth of <strong>the</strong> <strong>Lao</strong> <strong>PDR</strong> but also to <strong>the</strong> fact that restrictions, regulations <strong>and</strong> fees for natural resource extraction activities are more favourable to <strong>and</strong> flexible for <strong>in</strong>vestors than <strong>in</strong> many o<strong>the</strong>r resource-rich countries. 14 Of <strong>the</strong>se, 1,554 have area data <strong>and</strong> 151 do not (10% of all domestic deals). 15 Of <strong>the</strong>se, 118 have area data <strong>and</strong> 22 do not (16% of all jo<strong>in</strong>t venture deals). 16 Of <strong>the</strong>se, 679 have area data <strong>and</strong> 118 do not (15% of all foreign deals). RESULTS 23