2.1 - Inventory Overview In total, an area of 2.1 million hectares (ha) has been granted to <strong>in</strong>vestors, which can be compared roughly to <strong>the</strong> size of Savannakheth Prov<strong>in</strong>ce 4<strong>and</strong> around 9% of <strong>the</strong> total l<strong>and</strong> area of <strong>the</strong> <strong>Lao</strong> <strong>PDR</strong> 5. This 2.1 million ha, however, <strong>in</strong>cludes roughly one million ha granted for m<strong>in</strong><strong>in</strong>g exploration. M<strong>in</strong><strong>in</strong>g projects are dist<strong>in</strong>ct from those granted <strong>in</strong> o<strong>the</strong>r sectors due to <strong>the</strong>ir tendency to have vast areas devoted to m<strong>in</strong>eral exploration 6 with often little to no impact <strong>in</strong> terms of l<strong>and</strong> transformation <strong>and</strong> local livelihoods; m<strong>in</strong>eral extraction, <strong>in</strong> contrast, entails massive direct impacts, yet is often much smaller <strong>in</strong> terms of project area 7. The total amount of <strong>in</strong>vestment projects <strong>and</strong> <strong>the</strong>ir area dealt with here excludes m<strong>in</strong><strong>in</strong>g exploration projects with <strong>the</strong> exception of section 2.2.4, which focuses on m<strong>in</strong><strong>in</strong>g exploration specifically. Hydropower projects were not an explicit focus of <strong>the</strong> m<strong>and</strong>ate for data collection, nor do <strong>the</strong>y follow similar patterns of l<strong>and</strong> use or legal status to o<strong>the</strong>r l<strong>and</strong> concessions <strong>and</strong> leases. As a result, <strong>the</strong> data collection team did not prioritize hydropower projects, <strong>and</strong> <strong>the</strong>y were <strong>the</strong>refore excluded from this analysis. However, hydropower <strong>and</strong> m<strong>in</strong><strong>in</strong>g development <strong>in</strong> <strong>the</strong> <strong>Lao</strong> <strong>PDR</strong> is extensively analysed <strong>in</strong> <strong>the</strong> Report, “<strong>Lao</strong> <strong>PDR</strong> Development Report 2010 – Technical Note: The socio-geography of m<strong>in</strong><strong>in</strong>g <strong>and</strong> hydro <strong>in</strong> <strong>Lao</strong> <strong>PDR</strong>: Analysis comb<strong>in</strong><strong>in</strong>g GIS Information with Socioeconomic Data” (World Bank, 2010). After exclud<strong>in</strong>g m<strong>in</strong><strong>in</strong>g exploration <strong>and</strong> hydropower projects, <strong>the</strong> <strong>in</strong>ventory conta<strong>in</strong>s 2,642 leases <strong>and</strong> concessions cover<strong>in</strong>g 1.1 million ha. It should be noted, however, that project areas are known for only 2,350 of <strong>the</strong>se (or 89% of all projects), thus <strong>the</strong> 1.1 million ha <strong>the</strong>y cover can be considered a ra<strong>the</strong>r conservative estimate of <strong>the</strong> <strong>Lao</strong> <strong>PDR</strong>’s total area under <strong>in</strong>vestment. Still, this total represents approximately 5% of <strong>the</strong> <strong>Lao</strong> <strong>PDR</strong>’s whole l<strong>and</strong> area, or just over <strong>the</strong> entire area of Attapeu Prov<strong>in</strong>ce 8. F<strong>in</strong>ally, <strong>in</strong>vestment <strong>in</strong> l<strong>and</strong> is not necessarily only done through <strong>the</strong> concession <strong>and</strong> lease agreements <strong>in</strong>cluded <strong>in</strong> this analysis. In Nor<strong>the</strong>rn <strong>Lao</strong> <strong>PDR</strong> especially, a large portion of agriculture <strong>and</strong> tree plantation <strong>in</strong>vestment is done through contract farm<strong>in</strong>g arrangements which are not <strong>in</strong>cluded here. Therefore, <strong>the</strong> reported data may even fur<strong>the</strong>r underestimate <strong>the</strong> full scale of l<strong>and</strong> related <strong>in</strong>vestment <strong>in</strong> <strong>the</strong> <strong>Lao</strong> <strong>PDR</strong>. Never<strong>the</strong>less trends <strong>and</strong> emerg<strong>in</strong>g patterns <strong>in</strong> <strong>the</strong> distribution of l<strong>and</strong> <strong>in</strong>vestments across economic sectors, geographical regions <strong>and</strong> <strong>in</strong>vestors can be shown. 2.1.1 - Form of Investment The <strong>in</strong>ventory differentiates between two forms of <strong>in</strong>vestment: l<strong>and</strong> leases <strong>and</strong> concessions. Both forms of <strong>in</strong>vestment are granted on areas that are legally considered state l<strong>and</strong>. The ma<strong>in</strong> difference between concession <strong>and</strong> lease agreements lies <strong>in</strong> <strong>the</strong> parameters of <strong>the</strong>ir contractual arrangement <strong>and</strong> <strong>the</strong>ir legal status, which is expla<strong>in</strong>ed <strong>in</strong> Decree 135/PM 2009, Articles 2 <strong>and</strong> 4. Accord<strong>in</strong>g to those articles, concessions are assumed to <strong>in</strong>volve activities which utilize natural resources more <strong>in</strong>tensively, <strong>and</strong> <strong>the</strong>refore concessionaires are supposed “to pay l<strong>and</strong> concession fees, cost for national resources (royalties), tax, customs fees <strong>and</strong> o<strong>the</strong>r fees as specified <strong>in</strong> <strong>the</strong> [l<strong>and</strong>] law” (Art. 4 paragraph 2), while leases are assumed to host activities which are less resource <strong>in</strong>tensive <strong>and</strong> thus lessees need only “to pay <strong>the</strong> rental fee <strong>in</strong> accordance with <strong>the</strong> rate specified <strong>in</strong> <strong>the</strong> [l<strong>and</strong>] law <strong>and</strong> regulations” (Art. 4 paragraph 1) (GoL/NA, 2003). Out of all <strong>in</strong>vestment projects, 1,535 are concessions <strong>and</strong> 1,107 are leases (see Map 1). Lease projects were found to be much smaller <strong>in</strong> area (on average leases are three ha) than concessions (823 ha on average), <strong>and</strong> constitute less than one per cent of all state l<strong>and</strong> under <strong>in</strong>vestment (see Table 1). Overall, most <strong>in</strong>vestment projects are under five ha <strong>in</strong> size, with <strong>the</strong> majority of concessions ei<strong>the</strong>r under five ha or between 100 <strong>and</strong> 500 ha <strong>in</strong> size (406 <strong>and</strong> 378 concessions respectively). Still, an impressive number of l<strong>and</strong> deals (135 deals, all of which are concessions) are above 1,000 ha <strong>in</strong> size, <strong>and</strong> those 135 largest concessions alone comprise <strong>the</strong> vast majority (89%) of <strong>the</strong> total area under <strong>in</strong>vestment. The very few concessions over 10,000 ha comprise 59% of <strong>the</strong> total area under <strong>in</strong>vestment (see Figure 2). Table 1: Overview of <strong>Concessions</strong> <strong>and</strong> <strong>Leases</strong> # Deals Total Area (ha) Average Area (ha) 9 % Total # of all Deals % Total Area of all Deals <strong>Concessions</strong> 1,535 10 1,096,797 823 58% 99.8% <strong>Leases</strong> 1,107 11 2,737 3 41% 0.2% TOTAL 2,642 1,099,534 467 100% 100% 4 5 6 The total area of Savannakheth Prov<strong>in</strong>ce is 2,177,400 ha (MPI/DoS, 2005). The total area of <strong>the</strong> <strong>Lao</strong> <strong>PDR</strong> is 236,800 km2 or 23,680,000 ha, (MPI/DoS, 2005). In order to allow for consistent comparisons between national <strong>and</strong> regional averages, we use a slightly smaller figure (23,045,288 ha), which is derived from <strong>the</strong> measured areas of <strong>the</strong> <strong>Lao</strong> <strong>PDR</strong>’s North, Centre <strong>and</strong> South (see Table 5). M<strong>in</strong>eral exploration refers to <strong>the</strong> process of f<strong>in</strong>d<strong>in</strong>g ore to m<strong>in</strong>e, as opposed to m<strong>in</strong><strong>in</strong>g activities, which for <strong>the</strong> purposes of this publication are referred to as m<strong>in</strong><strong>in</strong>g exploitation. 20 <strong>Concessions</strong> <strong>and</strong> <strong>Leases</strong> <strong>in</strong> <strong>the</strong> <strong>Lao</strong> <strong>PDR</strong>: Tak<strong>in</strong>g Stock of L<strong>and</strong> Investments
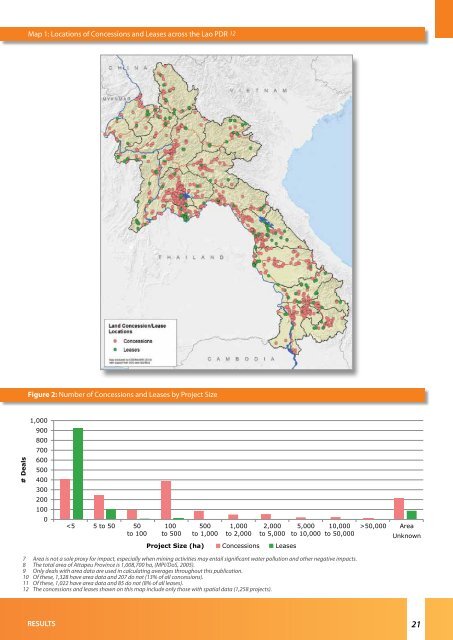
Map 1: Locations of <strong>Concessions</strong> <strong>and</strong> <strong>Leases</strong> across <strong>the</strong> <strong>Lao</strong> <strong>PDR</strong> 12 Figure 2: Number of <strong>Concessions</strong> <strong>and</strong> <strong>Leases</strong> by Project Size # Deals # Deals 1,000 1,000 900 900 800 800 700 700 600 600 500 500 400 400 300 300 200 200 100 100 0 0 7 8 9 10 11 12 50,000 Area 50,000 Area Unknown to 100 to 500 to 1,000 to 2,000 to 5,000 to 10,000 to 50,000 Unknown Project Size (ha) <strong>Concessions</strong> <strong>Leases</strong> Project Size (ha) <strong>Concessions</strong> <strong>Leases</strong> Area is not a sole proxy for impact, especially when m<strong>in</strong><strong>in</strong>g activities may entail significant water pollution <strong>and</strong> o<strong>the</strong>r negative impacts. The total area of Attapeu Prov<strong>in</strong>ce is 1,008,700 ha, (MPI/DoS, 2005). Only deals with area data are used <strong>in</strong> calculat<strong>in</strong>g averages throughout this publication. Of <strong>the</strong>se, 1,328 have area data <strong>and</strong> 207 do not (13% of all concessions). Of <strong>the</strong>se, 1,022 have area data <strong>and</strong> 85 do not (8% of all leases). The concessions <strong>and</strong> leases shown on this map <strong>in</strong>clude only those with spatial data (1,258 projects). RESULTS 21