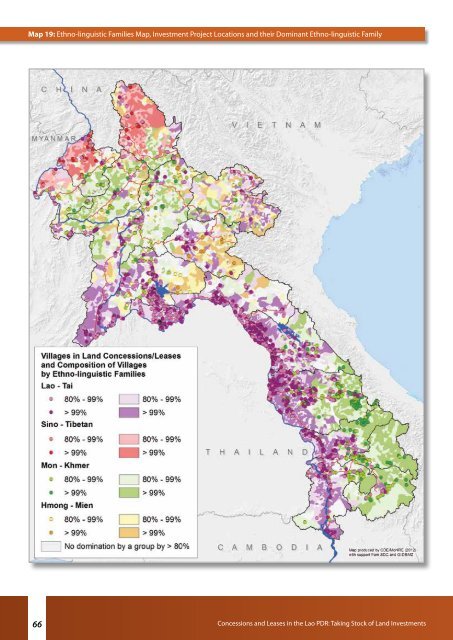
Map 19: Ethno-l<strong>in</strong>guistic Families Map, Investment Project Locations <strong>and</strong> <strong>the</strong>ir Dom<strong>in</strong>ant Ethno-l<strong>in</strong>guistic Family 66 <strong>Concessions</strong> <strong>and</strong> <strong>Leases</strong> <strong>in</strong> <strong>the</strong> <strong>Lao</strong> <strong>PDR</strong>: Tak<strong>in</strong>g Stock of L<strong>and</strong> Investments
3.4 - Forest Categories The GoL has placed 64% (14,808,991 ha) of <strong>the</strong> total l<strong>and</strong> cover of <strong>the</strong> <strong>Lao</strong> <strong>PDR</strong> under forest management categories – a significant amount, especially when compared to o<strong>the</strong>r countries <strong>in</strong> <strong>the</strong> region. These categories do not imply that <strong>the</strong> current l<strong>and</strong> cover is <strong>in</strong>deed forest, but sets <strong>the</strong>m aside to be managed as forest <strong>and</strong> places <strong>the</strong>ir governance under <strong>the</strong> overall forestry policy of <strong>the</strong> GoL. Thus <strong>the</strong> term ‘forest l<strong>and</strong>’ used <strong>in</strong> this section refers to all l<strong>and</strong> categorized as forest by <strong>the</strong> GoL regardless of that l<strong>and</strong>’s current l<strong>and</strong> cover or use. Despite cont<strong>in</strong>uous deforestation <strong>and</strong> forest degradation <strong>in</strong> <strong>the</strong> <strong>Lao</strong> <strong>PDR</strong>, <strong>the</strong> GoL plans <strong>in</strong> its Forestry Strategy to <strong>the</strong> Year 2020 to <strong>in</strong>crease forest cover from currently 41.2% to 70% of <strong>the</strong> country’s total l<strong>and</strong> area by 2020 (MAF, 2002). The <strong>Lao</strong> <strong>PDR</strong> Forestry Law (GoL/NA, 2011) specifies three different categories of forest: conservation forest, protection forest <strong>and</strong> production forest. Of <strong>the</strong> total area of <strong>the</strong> <strong>Lao</strong> <strong>PDR</strong>, 16% has been classified as conservation forest, or National Protected Areas (NPAs), 35% as protection forest <strong>and</strong> 13% as production forest (see Figure 23). Activities legally permitted with<strong>in</strong> conservation forest are <strong>the</strong> most restrictive of all forest management categories, followed by protection forest, <strong>and</strong> production forest areas are meant to be <strong>the</strong> forest category prioritized for tree plantations <strong>and</strong> o<strong>the</strong>r commercial forestry activities. While regulations <strong>and</strong> stipulations for <strong>the</strong> dist<strong>in</strong>ct management of each category of forest l<strong>and</strong> is typically expected to determ<strong>in</strong>e <strong>in</strong>vestment trends <strong>in</strong> such areas, <strong>the</strong>ir enforcement rema<strong>in</strong>s <strong>in</strong>consistent, leav<strong>in</strong>g room for wide debate around <strong>the</strong> impacts of large-scale l<strong>and</strong> <strong>in</strong>vestments <strong>and</strong> <strong>the</strong>ir potential to underm<strong>in</strong>e national objectives <strong>in</strong> forest management. A considerable share of <strong>the</strong> total area under <strong>in</strong>vestment (170,048 ha, or 29%), <strong>and</strong> also of <strong>the</strong> total <strong>in</strong>vestment projects granted (330 projects, or 26% of all projects), occur on l<strong>and</strong> categorized as forest while <strong>the</strong> o<strong>the</strong>r 71% is on non-forest l<strong>and</strong> 36 (see Figure 23). The majority of l<strong>and</strong> under <strong>in</strong>vestment categorized as forest falls <strong>in</strong>to <strong>the</strong> management category protection forest (23% of all area under <strong>in</strong>vestment), followed by conservation (4%) <strong>and</strong> production forest (2%). Look<strong>in</strong>g at <strong>the</strong> distribution of <strong>in</strong>vestment projects with<strong>in</strong> <strong>the</strong> three categories, 214 of <strong>the</strong> 330 37 total projects conta<strong>in</strong><strong>in</strong>g forest l<strong>and</strong>, account<strong>in</strong>g for 130,847 ha (77%) of <strong>the</strong> forest l<strong>and</strong> under <strong>in</strong>vestment, occur with<strong>in</strong> <strong>the</strong> protection category. Areas categorized as conservation forest have <strong>the</strong> second largest share of area under <strong>in</strong>vestment with 61 projects cover<strong>in</strong>g 24,828 ha (15% of all forest area under <strong>in</strong>vestment). This is a sizeable amount of l<strong>and</strong> consider<strong>in</strong>g that national regulations discourage l<strong>and</strong> <strong>in</strong>vestment <strong>in</strong> this forest category, though boundaries for forest categories have yet to be clearly established at <strong>the</strong> plann<strong>in</strong>g level <strong>and</strong> clearly demarcated on <strong>the</strong> ground <strong>and</strong> different state agencies operate us<strong>in</strong>g conflict<strong>in</strong>g boundaries. F<strong>in</strong>ally, only 14,374 ha (9%) across 81 projects occur with<strong>in</strong> areas categorized as production forest, which is surpris<strong>in</strong>gly small consider<strong>in</strong>g this is <strong>the</strong> forest category <strong>in</strong> which <strong>in</strong>vestment is encouraged. Not surpris<strong>in</strong>gly, over 96% of <strong>the</strong> area under <strong>in</strong>vestment <strong>in</strong> l<strong>and</strong> categorized as forest is with<strong>in</strong> <strong>the</strong> primary sector. Protection forest has <strong>the</strong> highest share with<strong>in</strong> all three sectors. Compared to <strong>the</strong> o<strong>the</strong>r sectors, <strong>the</strong> secondary sector has <strong>the</strong> highest proportion of total area occurr<strong>in</strong>g <strong>in</strong> forest categories, with <strong>the</strong> highest share of conservation forest proportionally (28% of l<strong>and</strong> <strong>in</strong> <strong>the</strong> secondary sector). It is also important when discuss<strong>in</strong>g <strong>the</strong> potential impacts <strong>and</strong> implications of l<strong>and</strong> <strong>in</strong>vestment to underst<strong>and</strong> which economic activities occur <strong>in</strong> <strong>the</strong>se areas. Of <strong>the</strong> projects occurr<strong>in</strong>g on l<strong>and</strong> categorized as forest, <strong>the</strong> three ma<strong>in</strong> subsectors are m<strong>in</strong><strong>in</strong>g, forestry <strong>and</strong> agriculture, which cover 51%, 35% <strong>and</strong> 9% of <strong>the</strong> total area of forest categories rented out (see Figure 24). It could be expected that <strong>in</strong>vestment <strong>in</strong> <strong>the</strong> forestry subsector would occur primarily <strong>in</strong> areas categorized as production forest, where regulations permit <strong>and</strong> encourage commercial plantation activities. Instead, only 13% of tree plantation <strong>in</strong>vestments fall with<strong>in</strong> this forest category while 71% occurs <strong>in</strong> protection forest <strong>and</strong> 17% <strong>in</strong> conservation forest. M<strong>in</strong><strong>in</strong>g, meanwhile, has <strong>the</strong> largest share of both conservation <strong>and</strong> protection forest under <strong>in</strong>vestment, constitut<strong>in</strong>g 57% <strong>and</strong> 56% respectively. As discussed <strong>in</strong> previous sections, primary sector deals are larger on average than those of o<strong>the</strong>r sectors, hence <strong>the</strong> extent of primary sector <strong>in</strong>vestment <strong>in</strong> forest l<strong>and</strong> can be expected to greatly impact l<strong>and</strong> use patterns <strong>and</strong> trends <strong>in</strong> those areas. Rubber is <strong>the</strong> dom<strong>in</strong>ant product occurr<strong>in</strong>g on l<strong>and</strong> categorized as forest, cover<strong>in</strong>g 31,019 ha (18%) of forest l<strong>and</strong> under <strong>in</strong>vestment (see Figure 25). Conversely, 28% of <strong>the</strong> total area under rubber production is with<strong>in</strong> forest areas with protection forest be<strong>in</strong>g <strong>the</strong> largest forest category (21%) under rubber <strong>in</strong>vestment. It is also <strong>the</strong> dom<strong>in</strong>ant product <strong>in</strong> areas categorized as conservation forest, with a total of 6,884 ha, constitut<strong>in</strong>g 28% of all conservation forest under <strong>in</strong>vestment. The question of which <strong>in</strong>vestors hold <strong>the</strong> greatest amount of area categorized as forest is also important, as it provides <strong>in</strong>direct <strong>in</strong>sights <strong>in</strong>to <strong>the</strong> <strong>in</strong>vestment behaviour of certa<strong>in</strong> groups of <strong>in</strong>vestors <strong>and</strong> <strong>the</strong> reach <strong>and</strong> efficacy of wider forest management regulations. Ch<strong>in</strong>a holds <strong>the</strong> greatest overall area categorized as forest (37,145 ha, or 24% of all area under Ch<strong>in</strong>ese <strong>in</strong>vestment), followed closely by Vietnam (33,484 ha, or 28% of all area under Vietnamese <strong>in</strong>vestment) (see Figure 26). Jo<strong>in</strong>t ventures hold a slightly smaller total area of forest l<strong>and</strong> (28,780 ha) but this constitutes 41% of <strong>the</strong> overall area under JV <strong>in</strong>vestment. The majority of forest l<strong>and</strong> under <strong>in</strong>vestment by each country is protection forest, though domestic <strong>in</strong>vestment st<strong>and</strong>s out as hav<strong>in</strong>g <strong>the</strong> highest proportion of conservation forest (10,554 ha or 13% of all area under domestic <strong>in</strong>vestment) followed by jo<strong>in</strong>t ventures (5,882 ha or 8% of all area under jo<strong>in</strong>t venture <strong>in</strong>vestment). 36 The total here refers to all of <strong>the</strong> <strong>in</strong>vestment projects spatially referenced; out of <strong>the</strong> 2,642 <strong>in</strong>vestment projects <strong>in</strong> <strong>the</strong> <strong>in</strong>ventory, 1,258 projects cover<strong>in</strong>g 587,564 ha are spatially referenced <strong>and</strong> are <strong>the</strong>refore considered <strong>in</strong> this section. 37 Some deals conta<strong>in</strong> more than one type of forest, <strong>the</strong>refore <strong>the</strong> sum of deals <strong>in</strong> each forest category is not equivalent to <strong>the</strong> total projects conta<strong>in</strong><strong>in</strong>g forest l<strong>and</strong>. CONTEXT OF INVESTMENT 67