- Page 1 and 2: Technische Universität Braunschwei
- Page 3 and 4: 4.4 Review of Current State of Rese
- Page 5 and 6: Index of Tables Table 2-1: Error of
- Page 7 and 8: 1 Introduction 1.1 Initial Position
- Page 9 and 10: 2 Sensor Based Temperature Monitori
- Page 11 and 12: compressor. They are served by a ce
- Page 13 and 14: the specified value, it works very
- Page 15 and 16: of this, over a hundred irregular p
- Page 17 and 18: a centralized one. An isolated appl
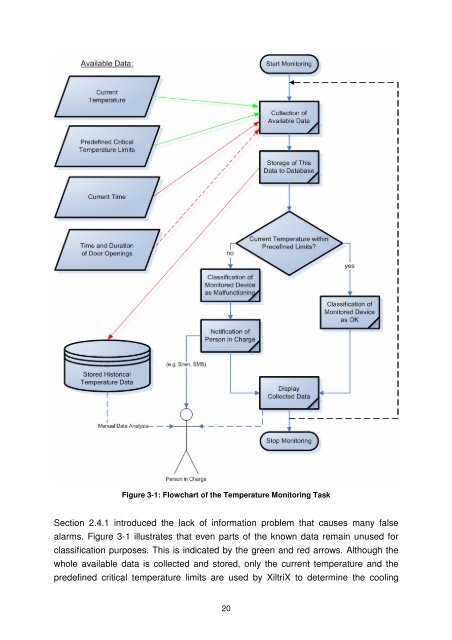
- Page 19 and 20: Figure 2-8: Lack of Information Pro
- Page 21 and 22: Moreover, the fridge’s filling le
- Page 23 and 24: store this kind of data but only of
- Page 25: 3 Current Monitoring Systems The la
- Page 29 and 30: a converter that is also available
- Page 31 and 32: To indicate important events within
- Page 33 and 34: 1. Display stored data in table for
- Page 35 and 36: This way of visualizing data is the
- Page 37 and 38: free text. Moreover it is possible
- Page 39 and 40: dependent limit and delay settings,
- Page 41 and 42: Aside from these functions, the kin
- Page 43 and 44: 1. Temperature verification in retr
- Page 45 and 46: alarms by the use of additionally a
- Page 47 and 48: The third mentioned Centron Environ
- Page 49 and 50: 4 Current State of Research As alre
- Page 51 and 52: even this improvement is still face
- Page 53 and 54: Another current approach is regress
- Page 55 and 56: S o n 2 = ∑ Yi −Yi n −1 i= 2
- Page 57 and 58: This algorithm returns an upper and
- Page 59 and 60: • Critical values • Pre-warning
- Page 61 and 62: 5 Possible and Promising Ways of Da
- Page 63 and 64: could be: “The mean increase of a
- Page 65 and 66: The mode is the most frequent value
- Page 67 and 68: Figure 5-1: Two Samples of Regressi
- Page 69 and 70: 5.4.2 The Major Problems of Regress
- Page 71 and 72: The next section will introduce tim
- Page 73 and 74: explained in section 5.4. If such a
- Page 75 and 76: pictured in Formula 5-12. Beside a
- Page 77 and 78:
P ( m) = P ( r ) ⋅ P ( m−r ) wi
- Page 79 and 80:
But the greatest problem is again t
- Page 81 and 82:
clustering as well as an analysis o
- Page 83 and 84:
The general idea of supervised lear
- Page 85 and 86:
sometimes data of a door opening se
- Page 87 and 88:
Beside the introduced notification
- Page 89 and 90:
A classification could be achieved
- Page 91 and 92:
Table 5-1: Estimated Improvements A
- Page 93 and 94:
As all these software products fail
- Page 95 and 96:
6.2 Case Study The UMC St. Radboud
- Page 97 and 98:
Figure 6-3: Maximum Values at Dayti
- Page 99 and 100:
Figure 6-5: Minimum Values at Dayti
- Page 101 and 102:
Figure 6-9: Standard Deviation at D
- Page 103 and 104:
Table 6-3: Reported Notifications (
- Page 105 and 106:
Important for the determination of
- Page 107 and 108:
Remarkable is a comparison to the a
- Page 109 and 110:
Interviews with several employees f
- Page 111 and 112:
7 Summary Cooling devices within me
- Page 113 and 114:
Bibliography Books and Articles: [B
- Page 115 and 116:
[Wittenberg98] Reinhard Wittenberg,
- Page 117 and 118:
Appendix 1 - Implementation of Inte
- Page 119 and 120:
%Name and location of the source fi
- Page 121 and 122:
Appendix 2 - Implementation of Stat
- Page 123 and 124:
dailydate = [dailydate; floor(date(
- Page 125 and 126:
%Count Dooropenings per Day dailydo
- Page 127 and 128:
xlswrite(strcat(path, 'Excel\', fil
- Page 129 and 130:
print('-dtiff', strcat(path, 'Graph
- Page 131 and 132:
ar([dailydate(1):dailydate(length(s
- Page 133 and 134:
Appendix 3 - Implementation of Data
- Page 135 and 136:
Duration = 0; maxtemp = 0; elseif (
- Page 137 and 138:
%Contains [Duration, Number of Occu
- Page 139 and 140:
disp(strcat('Dooropening