Casestudie Breakdown prediction Contell PILOT - Transumo
Casestudie Breakdown prediction Contell PILOT - Transumo
Casestudie Breakdown prediction Contell PILOT - Transumo
Create successful ePaper yourself
Turn your PDF publications into a flip-book with our unique Google optimized e-Paper software.
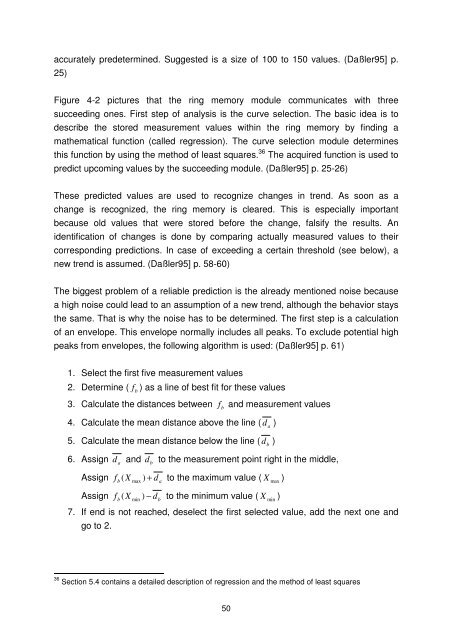
accurately predetermined. Suggested is a size of 100 to 150 values. (Daßler95] p.<br />
25)<br />
Figure 4-2 pictures that the ring memory module communicates with three<br />
succeeding ones. First step of analysis is the curve selection. The basic idea is to<br />
describe the stored measurement values within the ring memory by finding a<br />
mathematical function (called regression). The curve selection module determines<br />
this function by using the method of least squares. 36 The acquired function is used to<br />
predict upcoming values by the succeeding module. (Daßler95] p. 25-26)<br />
These predicted values are used to recognize changes in trend. As soon as a<br />
change is recognized, the ring memory is cleared. This is especially important<br />
because old values that were stored before the change, falsify the results. An<br />
identification of changes is done by comparing actually measured values to their<br />
corresponding <strong>prediction</strong>s. In case of exceeding a certain threshold (see below), a<br />
new trend is assumed. (Daßler95] p. 58-60)<br />
The biggest problem of a reliable <strong>prediction</strong> is the already mentioned noise because<br />
a high noise could lead to an assumption of a new trend, although the behavior stays<br />
the same. That is why the noise has to be determined. The first step is a calculation<br />
of an envelope. This envelope normally includes all peaks. To exclude potential high<br />
peaks from envelopes, the following algorithm is used: (Daßler95] p. 61)<br />
1. Select the first five measurement values<br />
2. Determine ( f b<br />
) as a line of best fit for these values<br />
3. Calculate the distances between f<br />
b<br />
and measurement values<br />
4. Calculate the mean distance above the line ( d<br />
a<br />
)<br />
5. Calculate the mean distance below the line ( d<br />
b<br />
)<br />
6. Assign d<br />
a<br />
and d<br />
b<br />
to the measurement point right in the middle,<br />
Assign<br />
f ( X<br />
max<br />
) + d to the maximum value ( X<br />
max<br />
)<br />
b<br />
a<br />
Assign<br />
f<br />
X )<br />
b<br />
( X<br />
min<br />
) − db<br />
to the minimum value (<br />
min<br />
7. If end is not reached, deselect the first selected value, add the next one and<br />
go to 2.<br />
36 Section 5.4 contains a detailed description of regression and the method of least squares<br />
50


