

Casestudie Breakdown prediction Contell PILOT - Transumo
Casestudie Breakdown prediction Contell PILOT - Transumo
Casestudie Breakdown prediction Contell PILOT - Transumo

Create successful ePaper yourself
Turn your PDF publications into a flip-book with our unique Google optimized e-Paper software.
This way of visualizing data is the most often way, past time data is looked at<br />
[Weerdesteyn06]. Due to missing additional decision support, this is currently the<br />
only way “data analysis” can be done. In fact, the person in charge has to analyze<br />
the behavior of the different monitored devices by having a look at their graphs. In<br />
case of an uncommon behavior, it is necessary to look at this specific graph more<br />
frequently.<br />
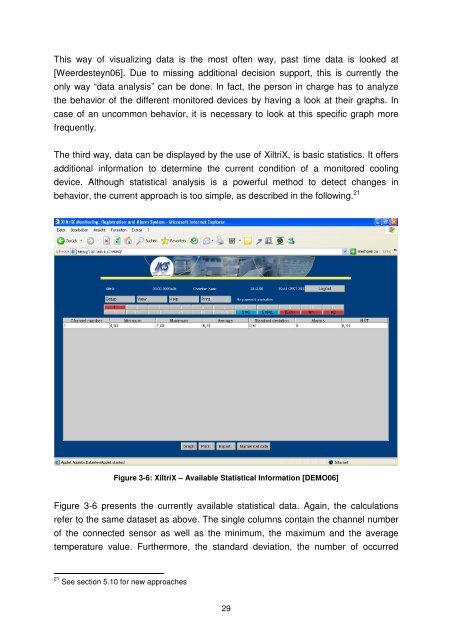
The third way, data can be displayed by the use of XiltriX, is basic statistics. It offers<br />
additional information to determine the current condition of a monitored cooling<br />
device. Although statistical analysis is a powerful method to detect changes in<br />
behavior, the current approach is too simple, as described in the following. 21<br />
Figure 3-6: XiltriX – Available Statistical Information [DEMO06]<br />
Figure 3-6 presents the currently available statistical data. Again, the calculations<br />
refer to the same dataset as above. The single columns contain the channel number<br />
of the connected sensor as well as the minimum, the maximum and the average<br />
temperature value. Furthermore, the standard deviation, the number of occurred<br />
21 See section 5.10 for new approaches<br />
29


