

Casestudie Breakdown prediction Contell PILOT - Transumo
Casestudie Breakdown prediction Contell PILOT - Transumo
Casestudie Breakdown prediction Contell PILOT - Transumo

Create successful ePaper yourself
Turn your PDF publications into a flip-book with our unique Google optimized e-Paper software.
1. Display stored data in table form<br />
2. Display stored data in graphical form<br />
3. Display basic statistical information<br />
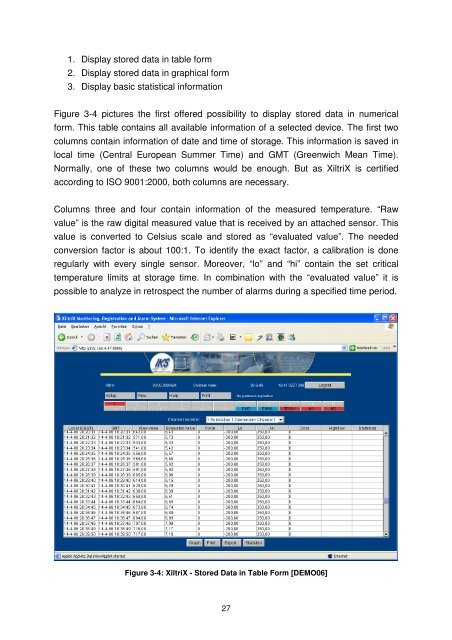
Figure 3-4 pictures the first offered possibility to display stored data in numerical<br />
form. This table contains all available information of a selected device. The first two<br />
columns contain information of date and time of storage. This information is saved in<br />
local time (Central European Summer Time) and GMT (Greenwich Mean Time).<br />
Normally, one of these two columns would be enough. But as XiltriX is certified<br />
according to ISO 9001:2000, both columns are necessary.<br />
Columns three and four contain information of the measured temperature. “Raw<br />
value” is the raw digital measured value that is received by an attached sensor. This<br />
value is converted to Celsius scale and stored as “evaluated value”. The needed<br />
conversion factor is about 100:1. To identify the exact factor, a calibration is done<br />
regularly with every single sensor. Moreover, “lo” and “hi” contain the set critical<br />
temperature limits at storage time. In combination with the “evaluated value” it is<br />
possible to analyze in retrospect the number of alarms during a specified time period.<br />
Figure 3-4: XiltriX - Stored Data in Table Form [DEMO06]<br />
27


