

Casestudie Breakdown prediction Contell PILOT - Transumo
Casestudie Breakdown prediction Contell PILOT - Transumo
Casestudie Breakdown prediction Contell PILOT - Transumo

You also want an ePaper? Increase the reach of your titles
YUMPU automatically turns print PDFs into web optimized ePapers that Google loves.
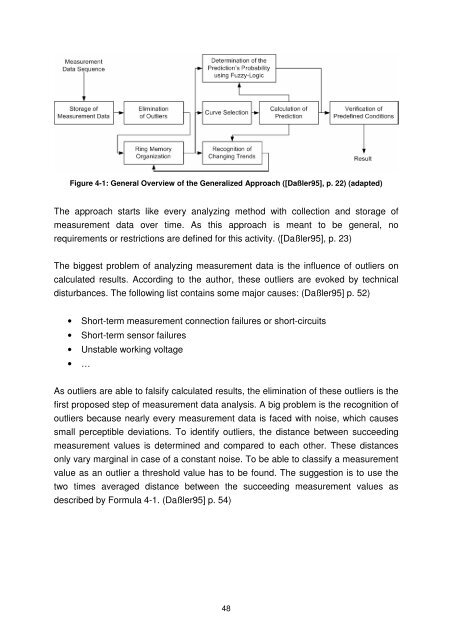
Figure 4-1: General Overview of the Generalized Approach ([Daßler95], p. 22) (adapted)<br />
The approach starts like every analyzing method with collection and storage of<br />
measurement data over time. As this approach is meant to be general, no<br />
requirements or restrictions are defined for this activity. ([Daßler95], p. 23)<br />
The biggest problem of analyzing measurement data is the influence of outliers on<br />
calculated results. According to the author, these outliers are evoked by technical<br />
disturbances. The following list contains some major causes: (Daßler95] p. 52)<br />
• Short-term measurement connection failures or short-circuits<br />
• Short-term sensor failures<br />
• Unstable working voltage<br />
• …<br />
As outliers are able to falsify calculated results, the elimination of these outliers is the<br />
first proposed step of measurement data analysis. A big problem is the recognition of<br />
outliers because nearly every measurement data is faced with noise, which causes<br />
small perceptible deviations. To identify outliers, the distance between succeeding<br />
measurement values is determined and compared to each other. These distances<br />
only vary marginal in case of a constant noise. To be able to classify a measurement<br />
value as an outlier a threshold value has to be found. The suggestion is to use the<br />
two times averaged distance between the succeeding measurement values as<br />
described by Formula 4-1. (Daßler95] p. 54)<br />
48


