WYNDHAM WORLDWIDE CORPORATION
WYNDHAM WORLDWIDE CORPORATION
WYNDHAM WORLDWIDE CORPORATION

You also want an ePaper? Increase the reach of your titles
YUMPU automatically turns print PDFs into web optimized ePapers that Google loves.
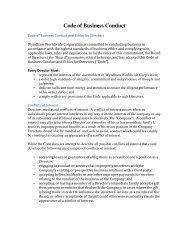
Stock Performance Graph<br />
The Stock Performance Graph is not deemed filed with the Commission and shall not be deemed incorporated<br />
by reference into any of our prior or future filings made with the Commission.<br />
The following line graph compares the cumulative total stockholder return of our common stock against the<br />
S&P 500 Index and the S&P Hotels, Resorts & Cruise Lines Index (consisting of Carnival plc, Marriott International<br />
Inc., Starwood Hotels & Resorts Worldwide, Inc. and Wyndham Worldwide Corporation) for the period from<br />
August 1, 2006 to December 31, 2010. The graph assumes that $100 was invested on August 1, 2006 and all<br />
dividends and other distributions were reinvested.<br />
(8/01/06 = $100)<br />
$140<br />
$120<br />
$100<br />
$80<br />
$60<br />
$40<br />
$20<br />
COMPARISON OF 53 MONTH CUMULATIVE TOTAL RETURN<br />
Among Wyndham Worldwide Corporation, the S&P 500 Index<br />
and the S&P Hotels, Resorts & Cruise Lines Index<br />
$0<br />
8/1/06 12/06 12/07<br />
12/08 12/09<br />
12/10<br />
Wyndham Worldwide Corporation S&P Hotels, Resorts & Cruise Lines Index S&P 500 Index<br />
Cumulative Total Return<br />
8/06 12/06 12/07 12/08 12/09 12/10<br />
Wyndham Worldwide Corporation $ 100.00 $ 100.53 $ 74.17 $ 20.96 $ 65.80 $ 99.69<br />
S&P 500 Index 100.00 112.05 118.21 74.47 94.18 108.37<br />
S&P Hotels, Resorts & Cruise Lines Index 100.00 126.79 111.05 57.61 89.79 137.62<br />
33