WYNDHAM WORLDWIDE CORPORATION
WYNDHAM WORLDWIDE CORPORATION
WYNDHAM WORLDWIDE CORPORATION

Create successful ePaper yourself
Turn your PDF publications into a flip-book with our unique Google optimized e-Paper software.
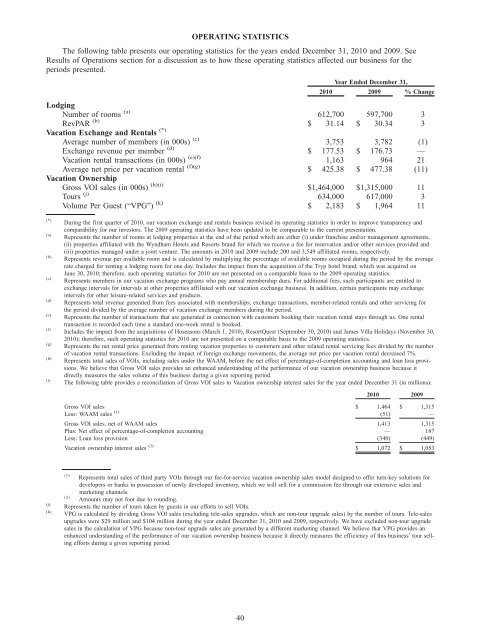
OPERATING STATISTICS<br />
The following table presents our operating statistics for the years ended December 31, 2010 and 2009. See<br />
Results of Operations section for a discussion as to how these operating statistics affected our business for the<br />
periods presented.<br />
Lodging<br />
Number of rooms (a)<br />
RevPAR (b)<br />
Vacation Exchange and Rentals (*)<br />
Average number of members (in 000s) (c)<br />
Exchange revenue per member (d)<br />
Vacation rental transactions (in 000s) (e)(f)<br />
Average net price per vacation rental (f)(g)<br />
Vacation Ownership<br />
Gross VOI sales (in 000s) (h)(i)<br />
(*)<br />
(a)<br />
(b)<br />
(c)<br />
(d)<br />
(e)<br />
(f)<br />
(g)<br />
(h)<br />
(i)<br />
(j)<br />
(k)<br />
Tours (j)<br />
Volume Per Guest (“VPG”) (k)<br />
Year Ended December 31,<br />
2010 2009 % Change<br />
612,700 597,700 3<br />
$ 31.14 $ 30.34 3<br />
3,753 3,782 (1)<br />
$ 177.53 $ 176.73 —<br />
1,163 964 21<br />
$ 425.38 $ 477.38 (11)<br />
$1,464,000 $1,315,000 11<br />
634,000 617,000 3<br />
$ 2,183 $ 1,964 11<br />
During the first quarter of 2010, our vacation exchange and rentals business revised its operating statistics in order to improve transparency and<br />
comparability for our investors. The 2009 operating statistics have been updated to be comparable to the current presentation.<br />
Represents the number of rooms at lodging properties at the end of the period which are either (i) under franchise and/or management agreements,<br />
(ii) properties affiliated with the Wyndham Hotels and Resorts brand for which we receive a fee for reservation and/or other services provided and<br />
(iii) properties managed under a joint venture. The amounts in 2010 and 2009 include 200 and 3,549 affiliated rooms, respectively.<br />
Represents revenue per available room and is calculated by multiplying the percentage of available rooms occupied during the period by the average<br />
rate charged for renting a lodging room for one day. Includes the impact from the acquisition of the Tryp hotel brand, which was acquired on<br />
June 30, 2010; therefore, such operating statistics for 2010 are not presented on a comparable basis to the 2009 operating statistics.<br />
Represents members in our vacation exchange programs who pay annual membership dues. For additional fees, such participants are entitled to<br />
exchange intervals for intervals at other properties affiliated with our vacation exchange business. In addition, certain participants may exchange<br />
intervals for other leisure-related services and products.<br />
Represents total revenue generated from fees associated with memberships, exchange transactions, member-related rentals and other servicing for<br />
the period divided by the average number of vacation exchange members during the period.<br />
Represents the number of transactions that are generated in connection with customers booking their vacation rental stays through us. One rental<br />
transaction is recorded each time a standard one-week rental is booked.<br />
Includes the impact from the acquisitions of Hoseasons (March 1, 2010), ResortQuest (September 30, 2010) and James Villa Holidays (November 30,<br />
2010); therefore, such operating statistics for 2010 are not presented on a comparable basis to the 2009 operating statistics.<br />
Represents the net rental price generated from renting vacation properties to customers and other related rental servicing fees divided by the number<br />
of vacation rental transactions. Excluding the impact of foreign exchange movements, the average net price per vacation rental decreased 7%.<br />
Represents total sales of VOIs, including sales under the WAAM, before the net effect of percentage-of-completion accounting and loan loss provisions.<br />
We believe that Gross VOI sales provides an enhanced understanding of the performance of our vacation ownership business because it<br />
directly measures the sales volume of this business during a given reporting period.<br />
The following table provides a reconciliation of Gross VOI sales to Vacation ownership interest sales for the year ended December 31 (in millions):<br />
2010 2009<br />
Gross VOI sales $ 1,464 $ 1,315<br />
Less: WAAM sales (1)<br />
(51) —<br />
Gross VOI sales, net of WAAM sales 1,413 1,315<br />
Plus: Net effect of percentage-of-completion accounting — 187<br />
Less: Loan loss provision (340) (449)<br />
Vacation ownership interest sales (2)<br />
$ 1,072 $ 1,053<br />
(1)<br />
Represents total sales of third party VOIs through our fee-for-service vacation ownership sales model designed to offer turn-key solutions for<br />
developers or banks in possession of newly developed inventory, which we will sell for a commission fee through our extensive sales and<br />
marketing channels.<br />
(2)<br />
Amounts may not foot due to rounding.<br />
Represents the number of tours taken by guests in our efforts to sell VOIs.<br />
VPG is calculated by dividing Gross VOI sales (excluding tele-sales upgrades, which are non-tour upgrade sales) by the number of tours. Tele-sales<br />
upgrades were $29 million and $104 million during the year ended December 31, 2010 and 2009, respectively. We have excluded non-tour upgrade<br />
sales in the calculation of VPG because non-tour upgrade sales are generated by a different marketing channel. We believe that VPG provides an<br />
enhanced understanding of the performance of our vacation ownership business because it directly measures the efficiency of this business’ tour selling<br />
efforts during a given reporting period.<br />
40