Toolkits for Urban Transport Development - UNEP
Toolkits for Urban Transport Development - UNEP
Toolkits for Urban Transport Development - UNEP

You also want an ePaper? Increase the reach of your titles
YUMPU automatically turns print PDFs into web optimized ePapers that Google loves.
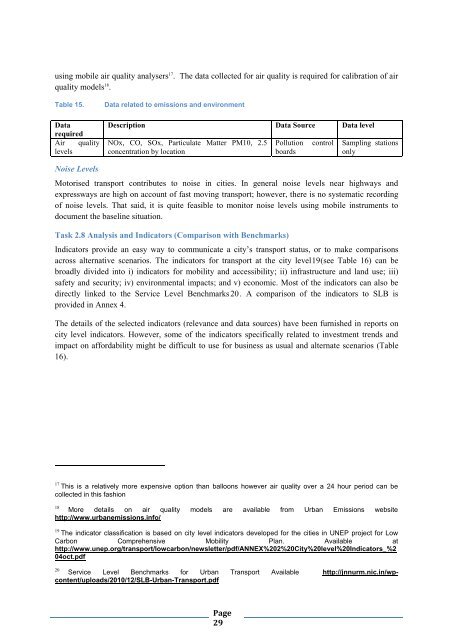
using mobile air quality analysers 17 . The data collected <strong>for</strong> air quality is required <strong>for</strong> calibration of air<br />
quality models 18 .<br />
Table 15.<br />
Data<br />
required<br />
Air quality<br />
levels<br />
Data related to emissions and environment<br />
Description Data Source Data level<br />
NOx, CO, SOx, Particulate Matter PM10, 2.5<br />
concentration by location<br />
Pollution<br />
boards<br />
control<br />
Sampling stations<br />
only<br />
Noise Levels<br />
Motorised transport contributes to noise in cities. In general noise levels near highways and<br />
expressways are high on account of fast moving transport; however, there is no systematic recording<br />
of noise levels. That said, it is quite feasible to monitor noise levels using mobile instruments to<br />
document the baseline situation.<br />
Task 2.8 Analysis and Indicators (Comparison with Benchmarks)<br />
Indicators provide an easy way to communicate a city’s transport status, or to make comparisons<br />
across alternative scenarios. The indicators <strong>for</strong> transport at the city level19(see Table 16) can be<br />
broadly divided into i) indicators <strong>for</strong> mobility and accessibility; ii) infrastructure and land use; iii)<br />
safety and security; iv) environmental impacts; and v) economic. Most of the indicators can also be<br />
directly linked to the Service Level Benchmarks 20. A comparison of the indicators to SLB is<br />
provided in Annex 4.<br />
The details of the selected indicators (relevance and data sources) have been furnished in reports on<br />
city level indicators. However, some of the indicators specifically related to investment trends and<br />
impact on af<strong>for</strong>dability might be difficult to use <strong>for</strong> business as usual and alternate scenarios (Table<br />
16).<br />
17 This is a relatively more expensive option than balloons however air quality over a 24 hour period can be<br />
collected in this fashion<br />
18<br />
More details on air quality models are available from <strong>Urban</strong> Emissions website<br />
http://www.urbanemissions.info/<br />
19 The indicator classification is based on city level indicators developed <strong>for</strong> the cities in <strong>UNEP</strong> project <strong>for</strong> Low<br />
Carbon Comprehensive Mobility Plan. Available at<br />
http://www.unep.org/transport/lowcarbon/newsletter/pdf/ANNEX%202%20City%20level%20Indicators_%2<br />
04oct.pdf<br />
20<br />
Service Level Benchmarks <strong>for</strong> <strong>Urban</strong> <strong>Transport</strong> Available http://jnnurm.nic.in/wpcontent/uploads/2010/12/SLB-<strong>Urban</strong>-<strong>Transport</strong>.pdf<br />
Page<br />
29