


Create successful ePaper yourself
Turn your PDF publications into a flip-book with our unique Google optimized e-Paper software.
hectares<br />
4. Murray Valley grape plantings 1997 to 2014<br />
4.1 Change in wine, table & dried plantings 1997 to 2014<br />
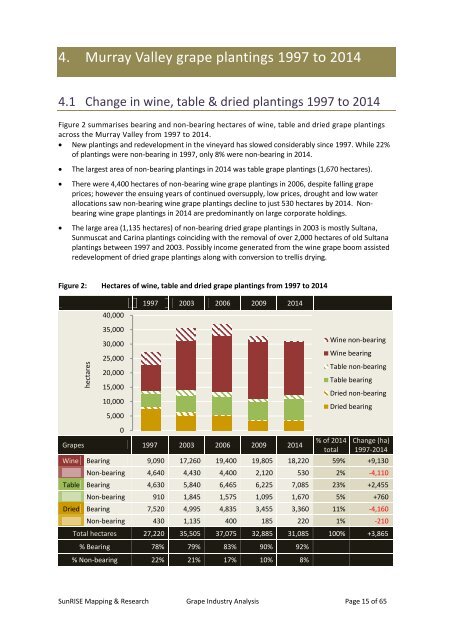
Figure 2 summarises bearing <strong>and</strong> non-bearing hectares of wine, table <strong>and</strong> dried grape plantings<br />
across the Murray Valley from 1997 to 2014.<br />
New plantings <strong>and</strong> redevelopment in the vineyard has slowed considerably since 1997. While 22%<br />
of plantings were non-bearing in 1997, only 8% were non-bearing in 2014.<br />
<br />
<br />
<br />
The largest area of non-bearing plantings in 2014 was table grape plantings (1,670 hectares).<br />
There were 4,400 hectares of non-bearing wine grape plantings in 2006, despite falling grape<br />
prices; however the ensuing years of continued oversupply, low prices, drought <strong>and</strong> low water<br />
allocations saw non-bearing wine grape plantings decline to just 530 hectares by 2014. Nonbearing<br />
wine grape plantings in 2014 are predominantly on large corporate holdings.<br />
The large area (1,135 hectares) of non-bearing dried grape plantings in 2003 is mostly Sultana,<br />
Sunmuscat <strong>and</strong> Carina plantings coinciding with the removal of over 2,000 hectares of old Sultana<br />
plantings between 1997 <strong>and</strong> 2003. Possibly income generated from the wine grape boom assisted<br />
redevelopment of dried grape plantings along with conversion to trellis drying.<br />
Figure 2: Hectares of wine, table <strong>and</strong> dried grape plantings from 1997 to 2014<br />
40,000<br />
1997 2003 2006 2009 2014<br />
35,000<br />
30,000<br />
25,000<br />
20,000<br />
15,000<br />
10,000<br />
5,000<br />
Wine non-bearing<br />
Wine bearing<br />
Table non-bearing<br />
Table bearing<br />
Dried non-bearing<br />
Dried bearing<br />
0<br />
<strong>Grape</strong>s 1997 2003 2006 2009 2014<br />
% of 2014<br />
total<br />
Change (ha)<br />
1997-2014<br />
Wine Bearing 9,090 17,260 19,400 19,805 18,220 59% +9,130<br />
Non-bearing 4,640 4,430 4,400 2,120 530 2% -4,110<br />
Table Bearing 4,630 5,840 6,465 6,225 7,085 23% +2,455<br />
Non-bearing 910 1,845 1,575 1,095 1,670 5% +760<br />
Dried Bearing 7,520 4,995 4,835 3,455 3,360 11% -4,160<br />
Non-bearing 430 1,135 400 185 220 1% -210<br />
Total hectares 27,220 35,505 37,075 32,885 31,085 100% +3,865<br />
% Bearing 78% 79% 83% 90% 92%<br />
% Non-bearing 22% 21% 17% 10% 8%<br />
SunRISE Mapping & Research <strong>Grape</strong> <strong>Industry</strong> <strong>Analysis</strong> Page 15 of 65