


Create successful ePaper yourself
Turn your PDF publications into a flip-book with our unique Google optimized e-Paper software.
White grapes<br />
Red grapes<br />
Black grapes<br />
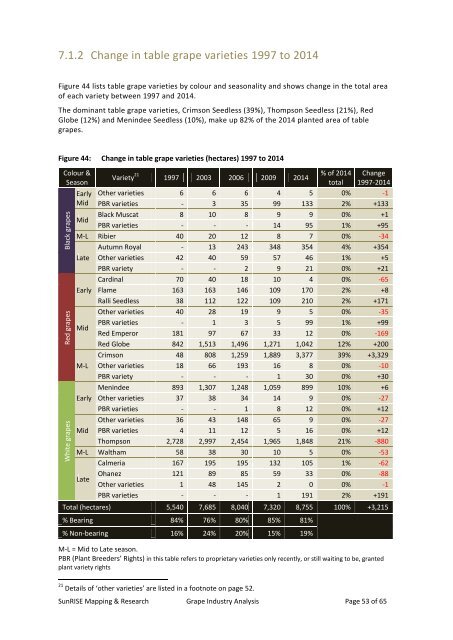
7.1.2 Change in table grape varieties 1997 to 2014<br />
Figure 44 lists table grape varieties by colour <strong>and</strong> seasonality <strong>and</strong> shows change in the total area<br />
of each variety between 1997 <strong>and</strong> 2014.<br />
The dominant table grape varieties, Crimson Seedless (39%), Thompson Seedless (21%), Red<br />
Globe (12%) <strong>and</strong> Menindee Seedless (10%), make up 82% of the 2014 planted area of table<br />
grapes.<br />
Figure 44: Change in table grape varieties (hectares) 1997 to 2014<br />
Colour &<br />
Variety 21 % of 2014 Change<br />
1997 2003 2006 2009 2014<br />
Season<br />
total 1997-2014<br />
Early Other varieties 6 6 6 4 5 0% -1<br />
Mid PBR varieties - 3 35 99 133 2% +133<br />
Mid<br />
Black Muscat 8 10 8 9 9 0% +1<br />
PBR varieties - - - 14 95 1% +95<br />
M-L Ribier 40 20 12 8 7 0% -34<br />
Autumn Royal - 13 243 348 354 4% +354<br />
Late Other varieties 42 40 59 57 46 1% +5<br />
PBR variety - - 2 9 21 0% +21<br />
Cardinal 70 40 18 10 4 0% -65<br />
Early Flame 163 163 146 109 170 2% +8<br />
Ralli Seedless 38 112 122 109 210 2% +171<br />
Other varieties 40 28 19 9 5 0% -35<br />
Mid<br />
PBR varieties - 1 3 5 99 1% +99<br />
Red Emperor 181 97 67 33 12 0% -169<br />
Red Globe 842 1,513 1,496 1,271 1,042 12% +200<br />
Crimson 48 808 1,259 1,889 3,377 39% +3,329<br />
M-L Other varieties 18 66 193 16 8 0% -10<br />
PBR variety - - - 1 30 0% +30<br />
Menindee 893 1,307 1,248 1,059 899 10% +6<br />
Early Other varieties 37 38 34 14 9 0% -27<br />
PBR varieties - - 1 8 12 0% +12<br />
Other varieties 36 43 148 65 9 0% -27<br />
Mid PBR varieties 4 11 12 5 16 0% +12<br />
Thompson 2,728 2,997 2,454 1,965 1,848 21% -880<br />
M-L Waltham 58 38 30 10 5 0% -53<br />
Calmeria 167 195 195 132 105 1% -62<br />
Late<br />
Ohanez 121 89 85 59 33 0% -88<br />
Other varieties 1 48 145 2 0 0% -1<br />
PBR varieties - - - 1 191 2% +191<br />
Total (hectares) 5,540 7,685 8,040 7,320 8,755 100% +3,215<br />
% Bearing 84% 76% 80% 85% 81%<br />
% Non-bearing 16% 24% 20% 15% 19%<br />
M-L = Mid to Late season.<br />
PBR (Plant Breeders’ Rights) in this table refers to proprietary varieties only recently, or still waiting to be, granted<br />
plant variety rights<br />
21 Details of ‘other varieties’ are listed in a footnote on page 52.<br />
SunRISE Mapping & Research <strong>Grape</strong> <strong>Industry</strong> <strong>Analysis</strong> Page 53 of 65