


You also want an ePaper? Increase the reach of your titles
YUMPU automatically turns print PDFs into web optimized ePapers that Google loves.
yield (tonnes/hectare)<br />
5.2 Wine grape production 1997 to 2014<br />
Estimates of wine grape yields (tonnes/hectare) in the Murray Valley study area were derived by<br />
dividing tonnages reported in annual Wine <strong>Grape</strong> Crush Surveys 7 by hectares of bearing vines<br />
from SunRISE crop mapping (Figure 12 <strong>and</strong> Figure 13).<br />
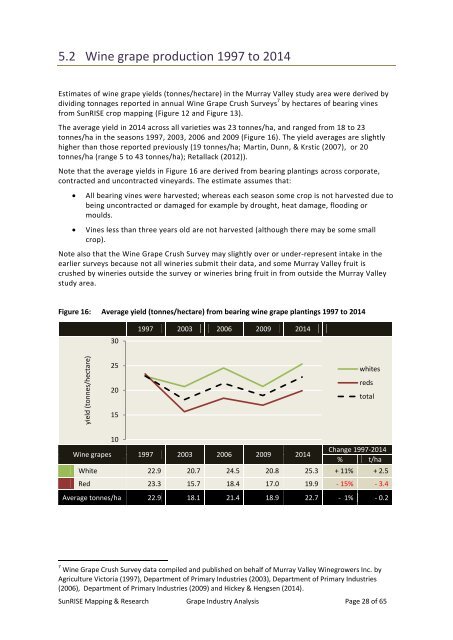
The average yield in 2014 across all varieties was 23 tonnes/ha, <strong>and</strong> ranged from 18 to 23<br />
tonnes/ha in the seasons 1997, 2003, 2006 <strong>and</strong> 2009 (Figure 16). The yield averages are slightly<br />
higher than those reported previously (19 tonnes/ha; Martin, Dunn, & Krstic (2007), or 20<br />
tonnes/ha (range 5 to 43 tonnes/ha); Retallack (2012)).<br />
Note that the average yields in Figure 16 are derived from bearing plantings across corporate,<br />
contracted <strong>and</strong> uncontracted vineyards. The estimate assumes that:<br />
<br />
All bearing vines were harvested; whereas each season some crop is not harvested due to<br />
being uncontracted or damaged <strong>for</strong> example by drought, heat damage, flooding or<br />
moulds.<br />
<br />
Vines less than three years old are not harvested (although there may be some small<br />
crop).<br />
Note also that the Wine <strong>Grape</strong> Crush Survey may slightly over or under-represent intake in the<br />
earlier surveys because not all wineries submit their data, <strong>and</strong> some Murray Valley fruit is<br />
crushed by wineries outside the survey or wineries bring fruit in from outside the Murray Valley<br />
study area.<br />
Figure 16: Average yield (tonnes/hectare) from bearing wine grape plantings 1997 to 2014<br />
30<br />
1997 2003 2006 2009 2014<br />
25<br />
20<br />
whites<br />
reds<br />
total<br />
15<br />
10<br />
Wine grapes 1997 2003 2006 2009 2014<br />
Change 1997-2014<br />
% t/ha<br />
White 22.9 20.7 24.5 20.8 25.3 + 11% + 2.5<br />
Red 23.3 15.7 18.4 17.0 19.9 - 15% - 3.4<br />
Average tonnes/ha 22.9 18.1 21.4 18.9 22.7 - 1% - 0.2<br />
7 Wine <strong>Grape</strong> Crush Survey data compiled <strong>and</strong> published on behalf of Murray Valley Winegrowers Inc. by<br />
Agriculture Victoria (1997), Department of Primary Industries (2003), Department of Primary Industries<br />
(2006), Department of Primary Industries (2009) <strong>and</strong> Hickey & Hengsen (2014).<br />
SunRISE Mapping & Research <strong>Grape</strong> <strong>Industry</strong> <strong>Analysis</strong> Page 28 of 65