


You also want an ePaper? Increase the reach of your titles
YUMPU automatically turns print PDFs into web optimized ePapers that Google loves.
Red<br />
White<br />
return ($/tonne)<br />
hectares planted (bearing<br />
<strong>and</strong> non bearing)<br />
return ($/tonne)<br />
hectares planted (bearing <strong>and</strong><br />
non bearing)<br />
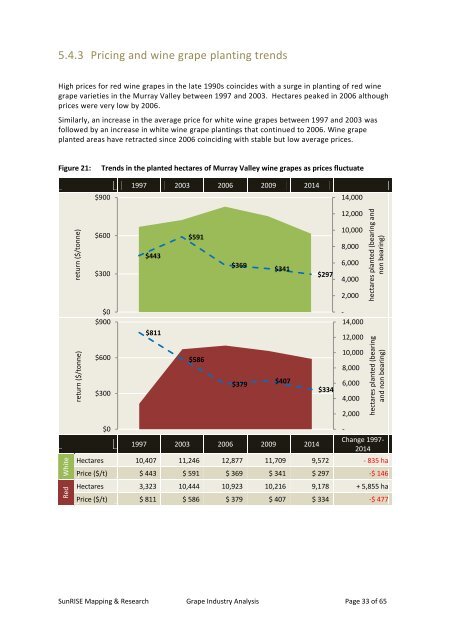
5.4.3 Pricing <strong>and</strong> wine grape planting trends<br />
High prices <strong>for</strong> red wine grapes in the late 1990s coincides with a surge in planting of red wine<br />
grape varieties in the Murray Valley between 1997 <strong>and</strong> 2003. Hectares peaked in 2006 although<br />
prices were very low by 2006.<br />
Similarly, an increase in the average price <strong>for</strong> white wine grapes between 1997 <strong>and</strong> 2003 was<br />
followed by an increase in white wine grape plantings that continued to 2006. Wine grape<br />
planted areas have retracted since 2006 coinciding with stable but low average prices.<br />
Figure 21:<br />
Trends in the planted hectares of Murray Valley wine grapes as prices fluctuate<br />
$900<br />
1997 2003 2006 2009 2014<br />
14,000<br />
12,000<br />
$600<br />
$300<br />
$443<br />
$591<br />
$369<br />
$341<br />
$297<br />
10,000<br />
8,000<br />
6,000<br />
4,000<br />
2,000<br />
$0<br />
$900<br />
$811<br />
-<br />
14,000<br />
12,000<br />
$600<br />
$586<br />
10,000<br />
8,000<br />
$300<br />
$379<br />
$407<br />
$334<br />
6,000<br />
4,000<br />
2,000<br />
$0<br />
1997 2003 2006 2009 2014<br />
-<br />
Change 1997-<br />
2014<br />
Hectares 10,407 11,246 12,877 11,709 9,572 - 835 ha<br />
Price ($/t) $ 443 $ 591 $ 369 $ 341 $ 297 -$ 146<br />
Hectares 3,323 10,444 10,923 10,216 9,178 + 5,855 ha<br />
Price ($/t) $ 811 $ 586 $ 379 $ 407 $ 334 -$ 477<br />
SunRISE Mapping & Research <strong>Grape</strong> <strong>Industry</strong> <strong>Analysis</strong> Page 33 of 65