


You also want an ePaper? Increase the reach of your titles
YUMPU automatically turns print PDFs into web optimized ePapers that Google loves.
Crop value<br />
($ million dollars)<br />
5.5 Crop value of wine grapes 1997 to 2014<br />
5.5.1 Regional income from wine grapes<br />
Crop values provide an indication of the (potential) contribution to regional or National income<br />
from annual production of a crop.<br />
Crop values <strong>for</strong> Murray Valley wine grapes are published in the annual Wine <strong>Grape</strong> Crush Surveys<br />
<strong>and</strong> are summarised in Figure 22.<br />
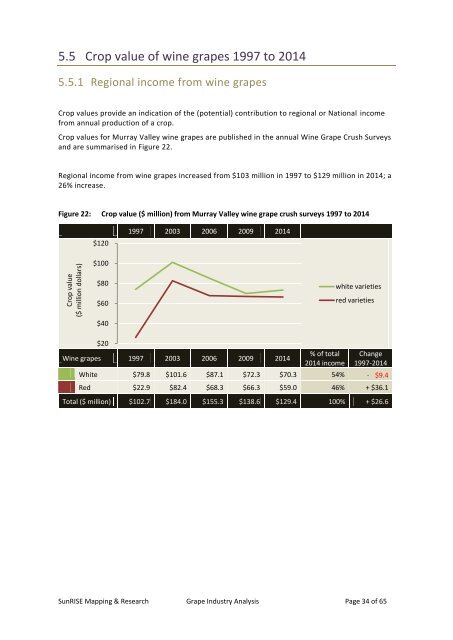
Regional income from wine grapes increased from $103 million in 1997 to $129 million in 2014; a<br />
26% increase.<br />
Figure 22: Crop value ($ million) from Murray Valley wine grape crush surveys 1997 to 2014<br />
$120<br />
1997 2003 2006 2009 2014<br />
$100<br />
$80<br />
$60<br />
white varieties<br />
red varieties<br />
$40<br />
$20<br />
Wine grapes 1997 2003 2006 2009 2014<br />
% of total<br />
2014 income<br />
Change<br />
1997-2014<br />
White $79.8 $101.6 $87.1 $72.3 $70.3 54% - $9.4<br />
Red $22.9 $82.4 $68.3 $66.3 $59.0 46% + $36.1<br />
7<br />
Total ($ million) $102.7 $184.0 $155.3 $138.6 $129.4 100% + $26.6<br />
SunRISE Mapping & Research <strong>Grape</strong> <strong>Industry</strong> <strong>Analysis</strong> Page 34 of 65