


You also want an ePaper? Increase the reach of your titles
YUMPU automatically turns print PDFs into web optimized ePapers that Google loves.
hectares<br />
5. Wine grape industry analysis<br />
5.1 Change in wine grape varieties 1997 to 2014<br />
5.1.1 Bearing <strong>and</strong> non-bearing plantings<br />
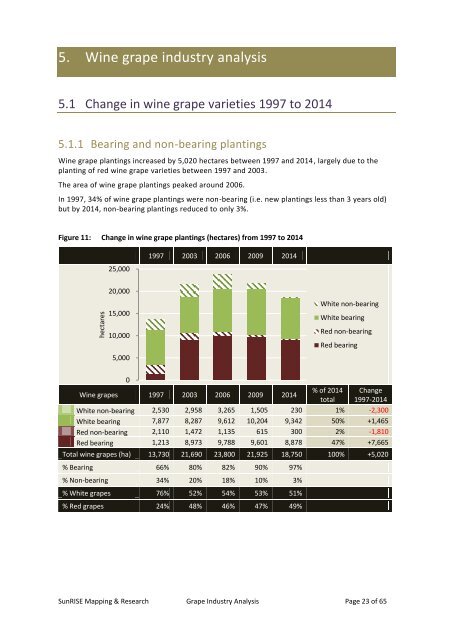
Wine grape plantings increased by 5,020 hectares between 1997 <strong>and</strong> 2014, largely due to the<br />
planting of red wine grape varieties between 1997 <strong>and</strong> 2003.<br />
The area of wine grape plantings peaked around 2006.<br />
In 1997, 34% of wine grape plantings were non-bearing (i.e. new plantings less than 3 years old)<br />
but by 2014, non-bearing plantings reduced to only 3%.<br />
Figure 11: Change in wine grape plantings (hectares) from 1997 to 2014<br />
25,000<br />
1997 2003 2006 2009 2014<br />
20,000<br />
15,000<br />
10,000<br />
5,000<br />
White non-bearing<br />
White bearing<br />
Red non-bearing<br />
Red bearing<br />
0<br />
Wine grapes 1997 2003 2006 2009 2014<br />
% of 2014<br />
total<br />
Change<br />
1997-2014<br />
White non-bearing 2,530 2,958 3,265 1,505 230 1% -2,300<br />
White bearing 7,877 8,287 9,612 10,204 9,342 50% +1,465<br />
Red non-bearing 2,110 1,472 1,135 615 300 2% -1,810<br />
Red bearing 1,213 8,973 9,788 9,601 8,878 47% +7,665<br />
Total wine grapes (ha) 13,730 21,690 23,800 21,925 18,750 100% +5,020<br />
% Bearing 66% 80% 82% 90% 97%<br />
% Non-bearing 34% 20% 18% 10% 3%<br />
% White grapes 76% 52% 54% 53% 51%<br />
% Red grapes 24% 48% 46% 47% 49%<br />
SunRISE Mapping & Research <strong>Grape</strong> <strong>Industry</strong> <strong>Analysis</strong> Page 23 of 65