


You also want an ePaper? Increase the reach of your titles
YUMPU automatically turns print PDFs into web optimized ePapers that Google loves.
Black<br />
Red<br />
White<br />
Contribution to regional<br />
income ($ million)<br />
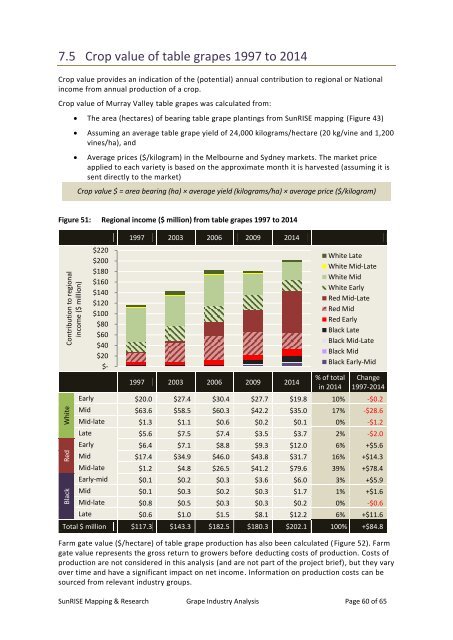
7.5 Crop value of table grapes 1997 to 2014<br />
Crop value provides an indication of the (potential) annual contribution to regional or National<br />
income from annual production of a crop.<br />
Crop value of Murray Valley table grapes was calculated from:<br />
The area (hectares) of bearing table grape plantings from SunRISE mapping (Figure 43)<br />
Assuming an average table grape yield of 24,000 kilograms/hectare (20 kg/vine <strong>and</strong> 1,200<br />
vines/ha), <strong>and</strong><br />
<br />
Average prices ($/kilogram) in the Melbourne <strong>and</strong> Sydney markets. The market price<br />
applied to each variety is based on the approximate month it is harvested (assuming it is<br />
sent directly to the market)<br />
Crop value $ = area bearing (ha) × average yield (kilograms/ha) × average price ($/kilogram)<br />
Figure 51: Regional income ($ million) from table grapes 1997 to 2014<br />
$220<br />
$200<br />
$180<br />
$160<br />
$140<br />
$120<br />
$100<br />
$80<br />
$60<br />
$40<br />
$20<br />
$-<br />
1997 2003 2006 2009 2014<br />
1997 2003 2006 2009 2014<br />
White Late<br />
White Mid-Late<br />
White Mid<br />
White Early<br />
Red Mid-Late<br />
Red Mid<br />
Red Early<br />
Black Late<br />
Black Mid-Late<br />
Black Mid<br />
Black Early-Mid<br />
% of total<br />
in 2014<br />
Change<br />
1997-2014<br />
Early $20.0 $27.4 $30.4 $27.7 $19.8 10% -$0.2<br />
Mid $63.6 $58.5 $60.3 $42.2 $35.0 17% -$28.6<br />
Mid-late $1.3 $1.1 $0.6 $0.2 $0.1 0% -$1.2<br />
Late $5.6 $7.5 $7.4 $3.5 $3.7 2% -$2.0<br />
Early $6.4 $7.1 $8.8 $9.3 $12.0 6% +$5.6<br />
Mid $17.4 $34.9 $46.0 $43.8 $31.7 16% +$14.3<br />
Mid-late $1.2 $4.8 $26.5 $41.2 $79.6 39% +$78.4<br />
Early-mid $0.1 $0.2 $0.3 $3.6 $6.0 3% +$5.9<br />
Mid $0.1 $0.3 $0.2 $0.3 $1.7 1% +$1.6<br />
Mid-late $0.8 $0.5 $0.3 $0.3 $0.2 0% -$0.6<br />
Late $0.6 $1.0 $1.5 $8.1 $12.2 6% +$11.6<br />
Total $ million $117.3 $143.3 $182.5 $180.3 $202.1 100% +$84.8<br />
Farm gate value ($/hectare) of table grape production has also been calculated (Figure 52). Farm<br />
gate value represents the gross return to growers be<strong>for</strong>e deducting costs of production. Costs of<br />
production are not considered in this analysis (<strong>and</strong> are not part of the project brief), but they vary<br />
over time <strong>and</strong> have a significant impact on net income. In<strong>for</strong>mation on production costs can be<br />
sourced from relevant industry groups.<br />
SunRISE Mapping & Research <strong>Grape</strong> <strong>Industry</strong> <strong>Analysis</strong> Page 60 of 65