


Create successful ePaper yourself
Turn your PDF publications into a flip-book with our unique Google optimized e-Paper software.
Yield (tonnes/hectare)<br />
6.2 Dried grape production 1997 to 2014<br />
The Murray Valley accounts <strong>for</strong> 98% of National dried grape production. Figure 31 shows<br />
production (dried tonnes) <strong>for</strong> the Murray Valley based on aggregated data from Horticulture<br />
Australia, made available by Dried Fruits Australia.<br />
Figure 31: Dried grapes from the Murray Valley (tonnes) delivered to packers 1997 to 2013<br />
1997 2003 2006 2009 2013<br />
% of total<br />
in 2013<br />
Change (t)<br />
1997-2013<br />
Sultanas 23,976 13,724 23,182 12,432 11,081 62% - 12,895<br />
Sunmuscat - 895 1,847 1,641 3,247 18% + 3,247<br />
Raisins 1,932 1,304 1,306 1,115 1,120 6% - 812<br />
Currants 2,893 2,010 2,689 1,999 2,494 14% - 399<br />
Other - 31 48 23 65 0% + 65<br />
Total dried tonnes 28,802 17,963 29,072 17,210 18,007 100% - 10,794<br />
Average yields (dried tonnes per hectare) <strong>for</strong> the Murray Valley were calculated from tonnages in<br />
Figure 31 <strong>and</strong> SunRISE hectares <strong>for</strong> bearing dried grape plantings (Figure 28).<br />
Yields have, in general, increased since 1997 with the average yield in 2013 40% (1.5 tonnes/ha)<br />
higher than in 1997. The 2013 yields are approximate as they are based on 2013 tonnages <strong>and</strong><br />
2014 hectares. 2014 tonnages were unavailable at the time of the analysis.<br />
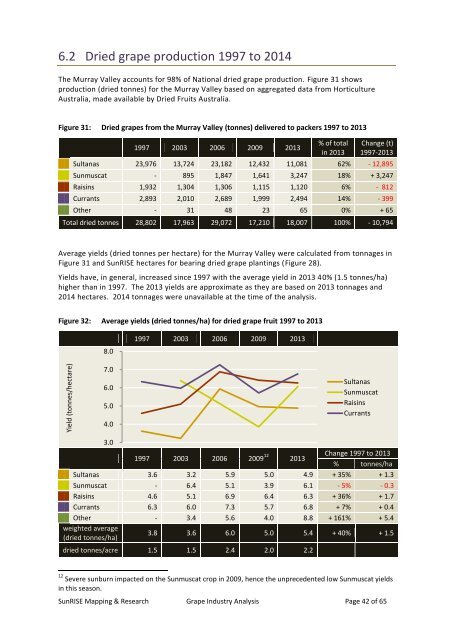
Figure 32: Average yields (dried tonnes/ha) <strong>for</strong> dried grape fruit 1997 to 2013<br />
8.0<br />
1997 2003 2006 2009 2013<br />
7.0<br />
6.0<br />
5.0<br />
4.0<br />
Sultanas<br />
Sunmuscat<br />
Raisins<br />
Currants<br />
3.0<br />
1997 2003 2006 2009 12 2013<br />
Change 1997 to 2013<br />
% tonnes/ha<br />
Sultanas 3.6 3.2 5.9 5.0 4.9 + 35% + 1.3<br />
Sunmuscat - 6.4 5.1 3.9 6.1 - 5% - 0.3<br />
Raisins 4.6 5.1 6.9 6.4 6.3 + 36% + 1.7<br />
Currants 6.3 6.0 7.3 5.7 6.8 + 7% + 0.4<br />
Other - 3.4 5.6 4.0 8.8 + 161% + 5.4<br />
weighted average<br />
(dried tonnes/ha)<br />
3.8 3.6 6.0 5.0 5.4 + 40% + 1.5<br />
dried tonnes/acre 1.5 1.5 2.4 2.0 2.2<br />
12 Severe sunburn impacted on the Sunmuscat crop in 2009, hence the unprecedented low Sunmuscat yields<br />
in this season.<br />
SunRISE Mapping & Research <strong>Grape</strong> <strong>Industry</strong> <strong>Analysis</strong> Page 42 of 65