


You also want an ePaper? Increase the reach of your titles
YUMPU automatically turns print PDFs into web optimized ePapers that Google loves.
Number of properties<br />
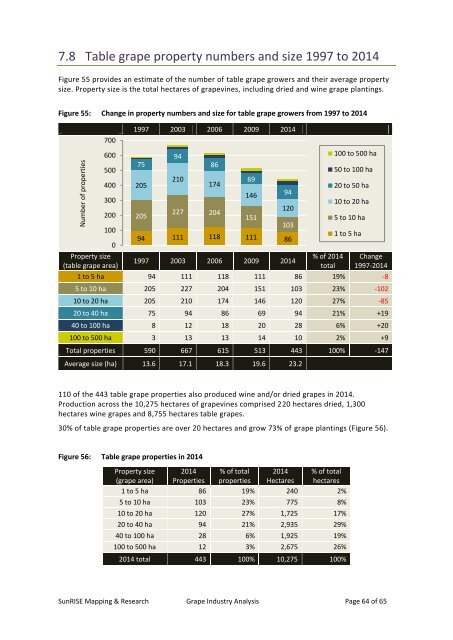
7.8 Table grape property numbers <strong>and</strong> size 1997 to 2014<br />
Figure 55 provides an estimate of the number of table grape growers <strong>and</strong> their average property<br />
size. Property size is the total hectares of grapevines, including dried <strong>and</strong> wine grape plantings.<br />
Figure 55: Change in property numbers <strong>and</strong> size <strong>for</strong> table grape growers from 1997 to 2014<br />
700<br />
600<br />
500<br />
400<br />
300<br />
200<br />
100<br />
0<br />
Property size<br />
(table grape area)<br />
1997 2003 2006 2009 2014<br />
75<br />
205<br />
205<br />
94<br />
210<br />
227 204<br />
94 111 118 111 86<br />
1997 2003 2006 2009 2014<br />
% of 2014<br />
total<br />
Change<br />
1997-2014<br />
1 to 5 ha 94 111 118 111 86 19% -8<br />
5 to 10 ha 205 227 204 151 103 23% -102<br />
10 to 20 ha 205 210 174 146 120 27% -85<br />
20 to 40 ha 75 94 86 69 94 21% +19<br />
40 to 100 ha 8 12 18 20 28 6% +20<br />
100 to 500 ha 3 13 13 14 10 2% +9<br />
Total properties 590 667 615 513 443 100% -147<br />
Average size (ha) 13.6 17.1 18.3 19.6 23.2<br />
86<br />
174<br />
69<br />
146<br />
151<br />
94<br />
120<br />
103<br />
100 to 500 ha<br />
50 to 100 ha<br />
20 to 50 ha<br />
10 to 20 ha<br />
5 to 10 ha<br />
1 to 5 ha<br />
110 of the 443 table grape properties also produced wine <strong>and</strong>/or dried grapes in 2014.<br />
Production across the 10,275 hectares of grapevines comprised 220 hectares dried, 1,300<br />
hectares wine grapes <strong>and</strong> 8,755 hectares table grapes.<br />
30% of table grape properties are over 20 hectares <strong>and</strong> grow 73% of grape plantings (Figure 56).<br />
Figure 56: Table grape properties in 2014<br />
Property size 2014 % of total 2014 % of total<br />
(grape area) Properties properties Hectares hectares<br />
1 to 5 ha 86 19% 240 2%<br />
5 to 10 ha 103 23% 775 8%<br />
10 to 20 ha 120 27% 1,725 17%<br />
20 to 40 ha 94 21% 2,935 29%<br />
40 to 100 ha 28 6% 1,925 19%<br />
100 to 500 ha 12 3% 2,675 26%<br />
2014 total 443 100% 10,275 100%<br />
SunRISE Mapping & Research <strong>Grape</strong> <strong>Industry</strong> <strong>Analysis</strong> Page 64 of 65