TABLE DRIED WINE 4.4 Farm gate value of wine, table <strong>and</strong> dried grapes Figure 5 shows the change in farm gate value of wine, dried <strong>and</strong> table grapes from 1997 to 2014. (Values are summarised from Figure 23, Figure 37 <strong>and</strong> Figure 52 respectively.) Farm gate value ($/hectare) represents the gross return to growers be<strong>for</strong>e deducting costs of production. Costs of production are not considered in this analysis (<strong>and</strong> are not a part of the project brief), but they vary <strong>for</strong> wine, dried <strong>and</strong> table grape production <strong>and</strong> vary over time having a significant impact on net income. For instance, while farm gate value of table grapes is much higher than wine <strong>and</strong> dried grapes, table grapes have considerably higher production costs impacting on net income. In<strong>for</strong>mation on costs of production can be sourced from relevant industry groups. Farm gate value of wine grapes declined by 37%; from $11,300 per hectare in 1997 to $7,100 per hectare in 2014. Farm gate values of sultanas, sunmuscats, raisins <strong>and</strong> currants increased between 1997 <strong>and</strong> 2014, with a 66% increase overall <strong>for</strong> dried grapes. Farm gate value of white table grapes decreased in the same period by 17%, but red <strong>and</strong> black table grapes increased by 31% <strong>and</strong> 88% respectively. Figure 5: Farm gate value (weighted average $/hectare) of wine, dried <strong>and</strong> table grapes <strong>Grape</strong>s 1997 2003 2006 2009 2014 $/hectare wine grapes Change 1997-2014 % $/ha White wine $10,127 $12,257 $9,058 $7,089 $7,528 -26% -$2,599 Red wine $18,917 $9,180 $6,975 $6,901 $6,650 -65% -$12,267 $11,300 $10,658 $8,007 $6,998 $7,100 -37% - 4,200 Sultanas $5,031 $4,269 $7,150 $8,749 $8,300 +65% +$3,269 Sunmuscat - $8,289 $6,469 $6,882 $10,313 +24% +$2,024 $/hectare dried grapes $/hectare table grapes Raisins $8,048 $8,677 $11,172 $11,709 $10,877 +35% +$2,829 Currants $9,867 $11,171 $9,301 $10,033 $11,326 +15% +$1,460 Other dried - $7,046 $6,782 $14,676 $14,924 +112% +$7,878 $5,479 $5,076 $7,422 $8,802 $9,104 +66% +$3,625 White table $25,409 $27,318 $24,468 $20,145 $21,112 -17% -$4,246 Red table $25,506 $26,304 $31,359 $36,533 $33,295 +31% +$8,224 Black table $21,474 $26,659 $30,577 $33,624 $40,396 +88% +$18,180 $24,657 $26,728 $28,859 $31,625 $29,425 +19% +$4,768 SunRISE Mapping & Research <strong>Grape</strong> <strong>Industry</strong> <strong>Analysis</strong> Page 18 of 65
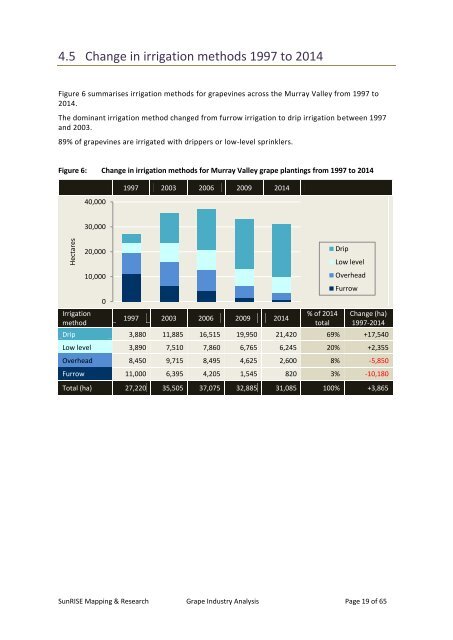
Hectares 4.5 Change in irrigation methods 1997 to 2014 Figure 6 summarises irrigation methods <strong>for</strong> grapevines across the Murray Valley from 1997 to 2014. The dominant irrigation method changed from furrow irrigation to drip irrigation between 1997 <strong>and</strong> 2003. 89% of grapevines are irrigated with drippers or low-level sprinklers. Figure 6: Change in irrigation methods <strong>for</strong> Murray Valley grape plantings from 1997 to 2014 40,000 1997 2003 2006 2009 2014 30,000 Irrigation method 20,000 10,000 0 1997 2003 2006 2009 2014 % of 2014 total Change (ha) 1997-2014 Drip 3,880 11,885 16,515 19,950 21,420 69% +17,540 Low level 3,890 7,510 7,860 6,765 6,245 20% +2,355 Overhead 8,450 9,715 8,495 4,625 2,600 8% -5,850 Furrow 11,000 6,395 4,205 1,545 820 3% -10,180 Total (ha) 27,220 35,505 37,075 32,885 31,085 100% +3,865 Drip Low level Overhead Furrow SunRISE Mapping & Research <strong>Grape</strong> <strong>Industry</strong> <strong>Analysis</strong> Page 19 of 65