


You also want an ePaper? Increase the reach of your titles
YUMPU automatically turns print PDFs into web optimized ePapers that Google loves.
gross income ($/ha)<br />
6.5.2 Farm gate value of dried grape fruit from 1997 to 2014<br />
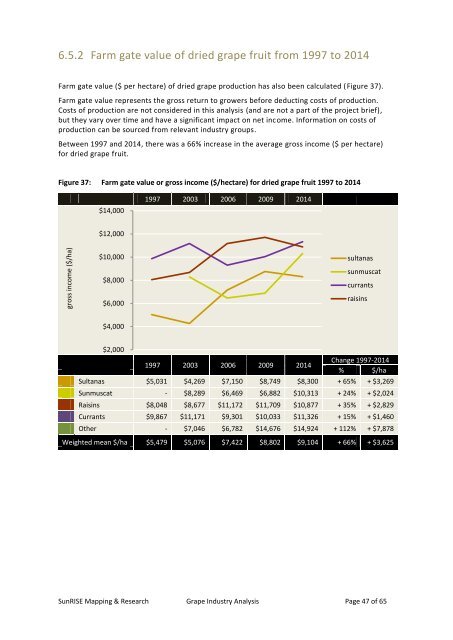
Farm gate value ($ per hectare) of dried grape production has also been calculated (Figure 37).<br />
Farm gate value represents the gross return to growers be<strong>for</strong>e deducting costs of production.<br />
Costs of production are not considered in this analysis (<strong>and</strong> are not a part of the project brief),<br />
but they vary over time <strong>and</strong> have a significant impact on net income. In<strong>for</strong>mation on costs of<br />
production can be sourced from relevant industry groups.<br />
Between 1997 <strong>and</strong> 2014, there was a 66% increase in the average gross income ($ per hectare)<br />
<strong>for</strong> dried grape fruit.<br />
Figure 37: Farm gate value or gross income ($/hectare) <strong>for</strong> dried grape fruit 1997 to 2014<br />
$14,000<br />
1997 2003 2006 2009 2014<br />
$12,000<br />
$10,000<br />
$8,000<br />
$6,000<br />
sultanas<br />
sunmuscat<br />
currants<br />
raisins<br />
$4,000<br />
$2,000<br />
1997 2003 2006 2009 2014<br />
Change 1997-2014<br />
% $/ha<br />
Sultanas $5,031 $4,269 $7,150 $8,749 $8,300 + 65% + $3,269<br />
Sunmuscat - $8,289 $6,469 $6,882 $10,313 + 24% + $2,024<br />
Raisins $8,048 $8,677 $11,172 $11,709 $10,877 + 35% + $2,829<br />
Currants $9,867 $11,171 $9,301 $10,033 $11,326 + 15% + $1,460<br />
Other - $7,046 $6,782 $14,676 $14,924 + 112% + $7,878<br />
Weighted mean $/ha $5,479 $5,076 $7,422 $8,802 $9,104 + 66% + $3,625<br />
SunRISE Mapping & Research <strong>Grape</strong> <strong>Industry</strong> <strong>Analysis</strong> Page 47 of 65