


You also want an ePaper? Increase the reach of your titles
YUMPU automatically turns print PDFs into web optimized ePapers that Google loves.
Hectares<br />
7. Table grape industry analysis<br />
7.1 Change in table grape plantings 1997 to 2014<br />
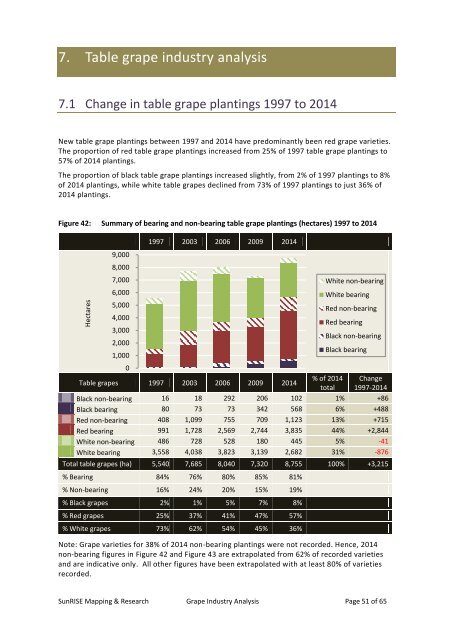
New table grape plantings between 1997 <strong>and</strong> 2014 have predominantly been red grape varieties.<br />
The proportion of red table grape plantings increased from 25% of 1997 table grape plantings to<br />
57% of 2014 plantings.<br />
The proportion of black table grape plantings increased slightly, from 2% of 1 997 plantings to 8%<br />
of 2014 plantings, while white table grapes declined from 73% of 1997 plantings to just 36% of<br />
2014 plantings.<br />
Figure 42: Summary of bearing <strong>and</strong> non-bearing table grape plantings (hectares) 1997 to 2014<br />
9,000<br />
8,000<br />
7,000<br />
6,000<br />
5,000<br />
4,000<br />
3,000<br />
2,000<br />
1,000<br />
0<br />
1997 2003 2006 2009 2014<br />
Table grapes 1997 2003 2006 2009 2014<br />
% of 2014<br />
total<br />
Change<br />
1997-2014<br />
Black non-bearing 16 18 292 206 102 1% +86<br />
Black bearing 80 73 73 342 568 6% +488<br />
Red non-bearing 408 1,099 755 709 1,123 13% +715<br />
Red bearing 991 1,728 2,569 2,744 3,835 44% +2,844<br />
White non-bearing 486 728 528 180 445 5% -41<br />
White bearing 3,558 4,038 3,823 3,139 2,682 31% -876<br />
Total table grapes (ha) 5,540 7,685 8,040 7,320 8,755 100% +3,215<br />
% Bearing 84% 76% 80% 85% 81%<br />
% Non-bearing 16% 24% 20% 15% 19%<br />
% Black grapes 2% 1% 5% 7% 8%<br />
% Red grapes 25% 37% 41% 47% 57%<br />
% White grapes 73% 62% 54% 45% 36%<br />
White non-bearing<br />
White bearing<br />
Red non-bearing<br />
Red bearing<br />
Black non-bearing<br />
Black bearing<br />
Note: <strong>Grape</strong> varieties <strong>for</strong> 38% of 2014 non-bearing plantings were not recorded. Hence, 2014<br />
non-bearing figures in Figure 42 <strong>and</strong> Figure 43 are extrapolated from 62% of recorded varieties<br />
<strong>and</strong> are indicative only. All other figures have been extrapolated with at least 80% of varieties<br />
recorded.<br />
SunRISE Mapping & Research <strong>Grape</strong> <strong>Industry</strong> <strong>Analysis</strong> Page 51 of 65